
Plain-English analysis
Ask questions in plain English and get AI-driven analysis without writing SQL, Python, or Excel formulas.

OrangeLabs is an AI data visualization platform that helps non-technical professionals query raw data, build interactive visuals, and generate slides or document-ready outputs. The site also shows a 7-day free trial on the Starter plan.
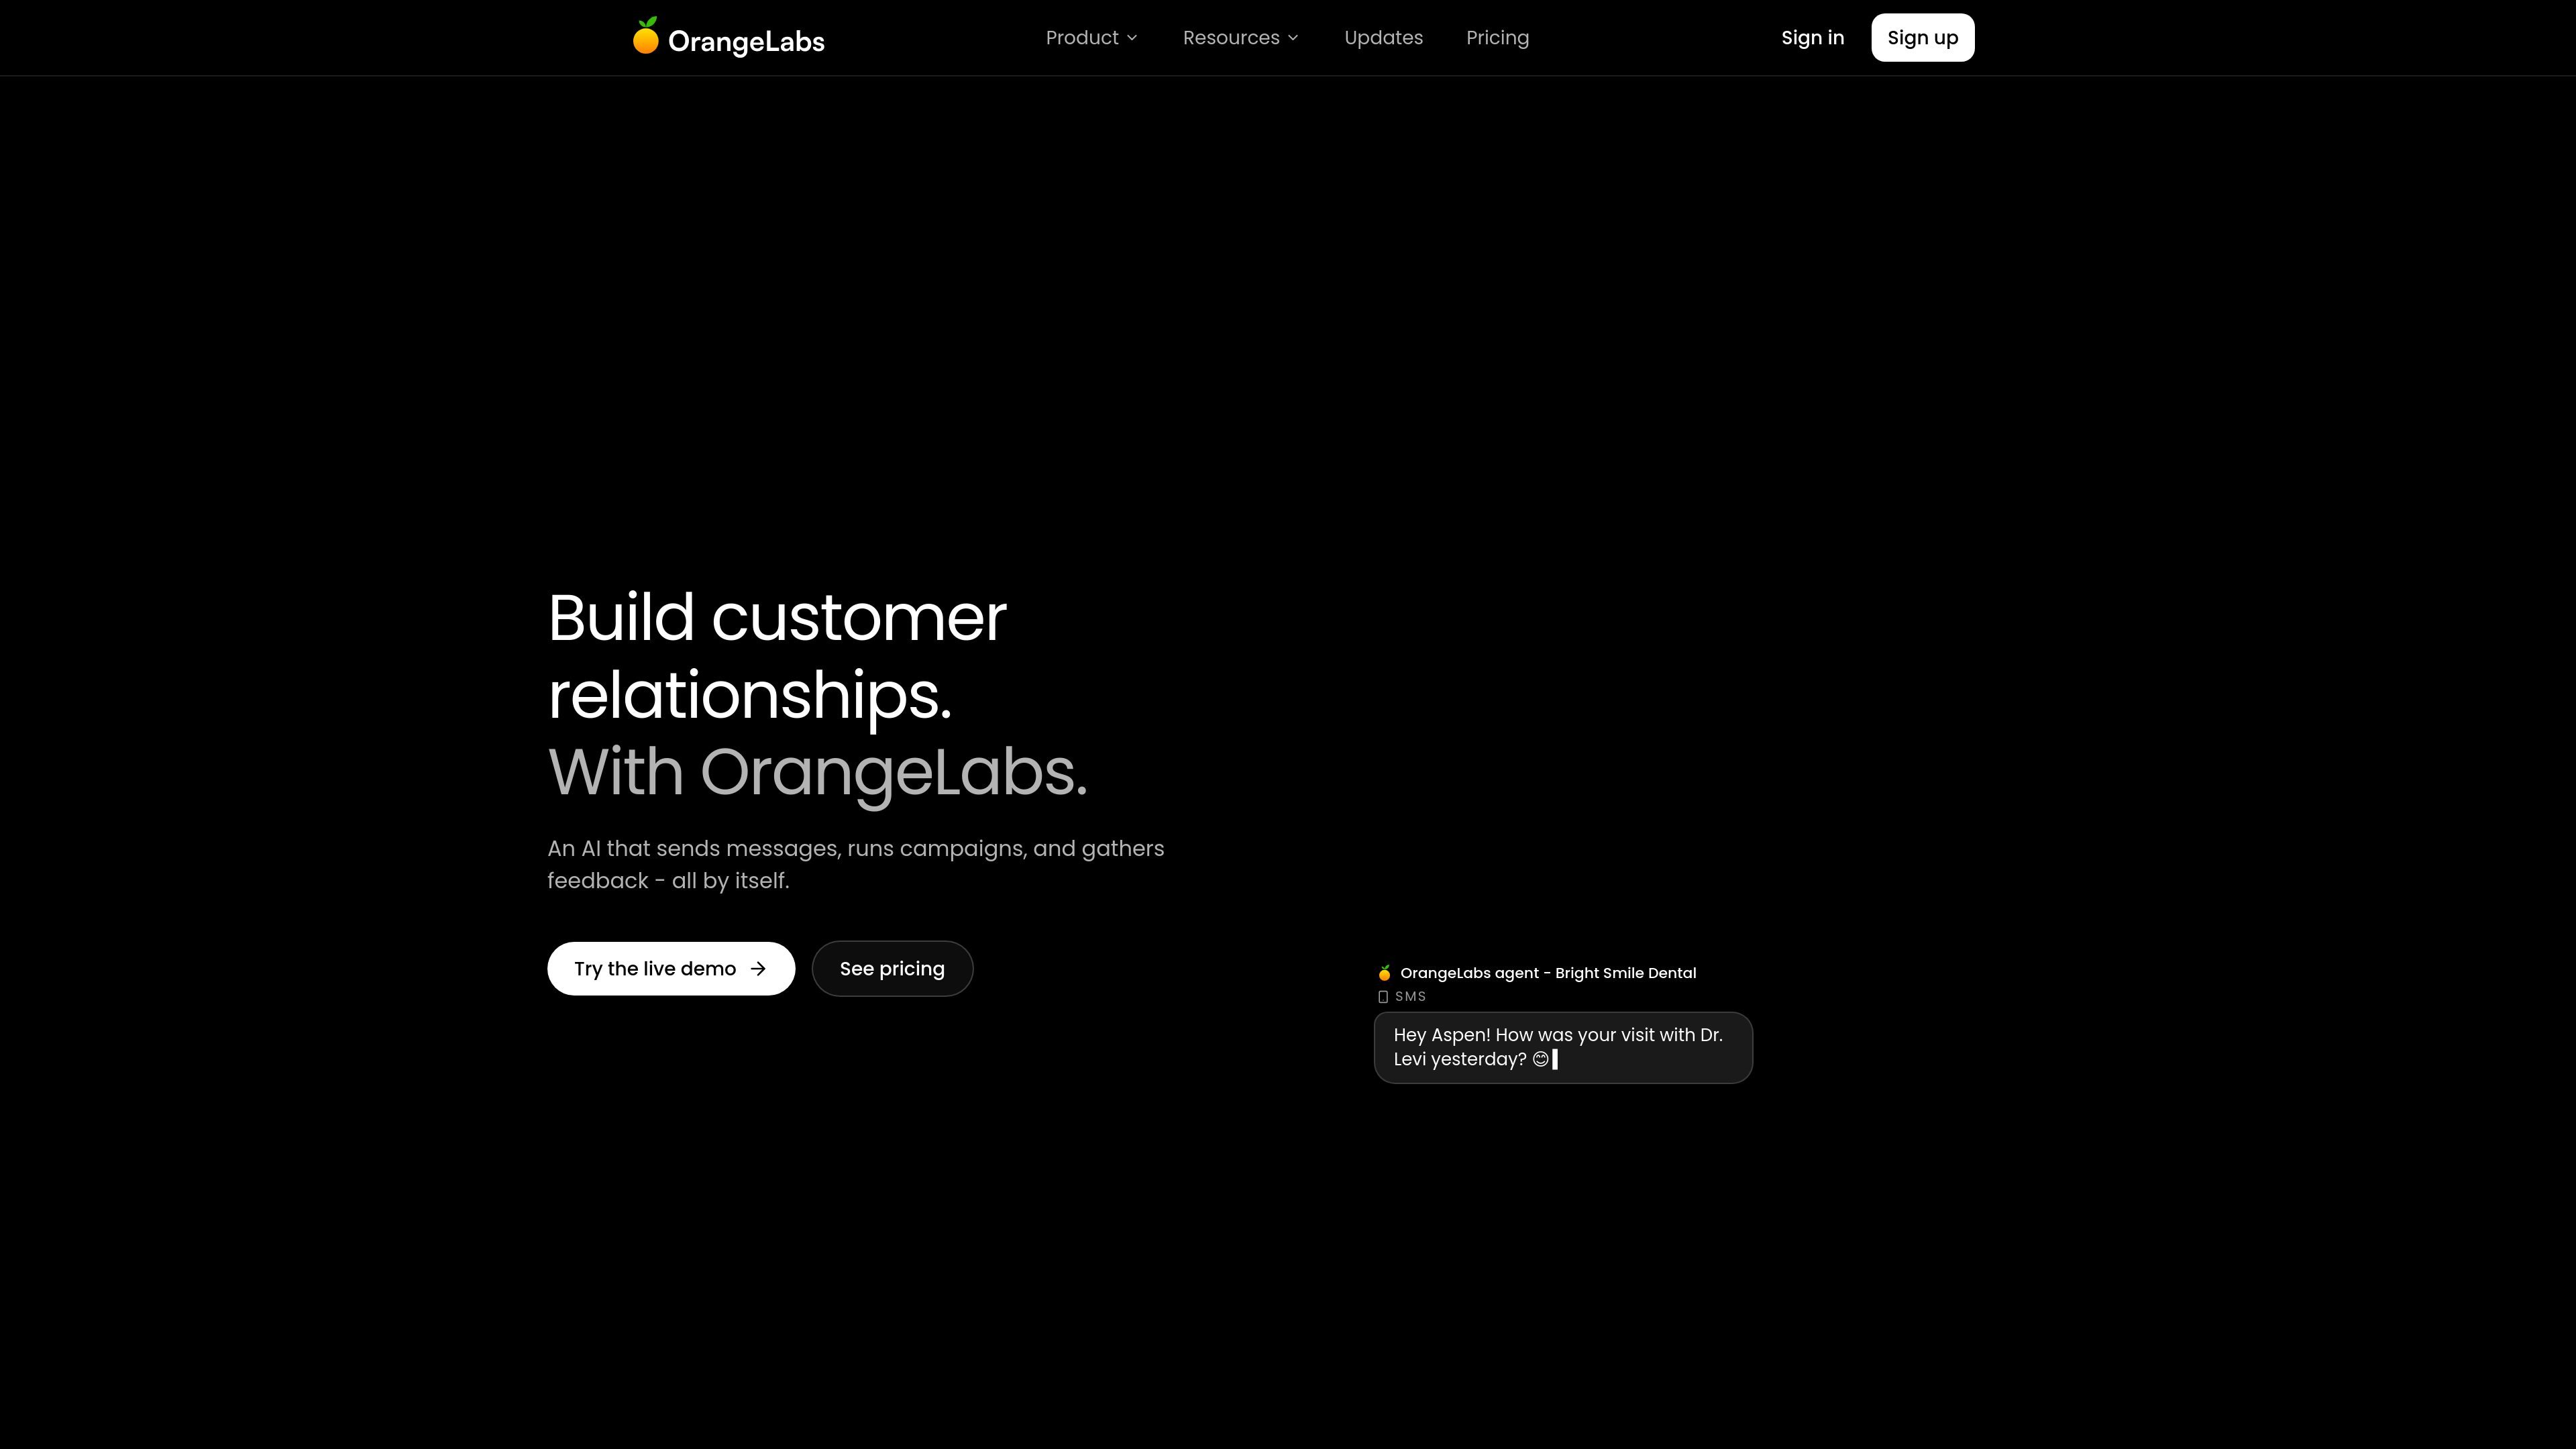
OrangeLabs is an AI data platform for querying raw data and turning the results into interactive visuals, slides, and document-ready outputs. The site positions it for people who want to analyze data and build visuals without relying on SQL, Python, or Excel formulas.
Its public pages emphasize business workflows such as analyzing spreadsheets and PDFs, creating editable charts, and generating presentation-ready outputs from plain-English prompts. The pricing page also shows a 7-day free trial on the Starter plan with monthly and annual billing options.
Ask questions in plain English and get AI-driven analysis without writing SQL, Python, or Excel formulas.
Upload documents and spreadsheets for extraction, categorization, and deeper inspection of raw rows or unstructured files.
Turn insights into editable charts and visuals, including chart types such as pie charts, sunburst graphs, and bar graphs.
Create presentation-ready slides from raw insights and visuals for reporting or sharing results.
Work across multiple languages, with the analytics page calling out multilingual support for the AI data agent.
Use a large set of ready-made prompts and templates, described on the site as 40+ visual prompts and templates.
Finance teams can use OrangeLabs to automate reporting, track expenses, and build dashboards without code.
Operations or business teams can upload spreadsheets or PDFs, then extract key insights and organize them into usable outputs.
Teams that need to share findings can turn raw insights and visuals into presentation-ready slides.
Organizations with mixed technical skill levels can ask questions in plain English instead of using SQL, Python, or Excel formulas.
Teams that work across different tools can connect common business data sources referenced on the site, such as Sheets, Excel, CSV, Notion, Slack, HubSpot, Salesforce, Airtable, Postgres, Stripe, and Gmail, while confirming current availability before rollout.
OrangeLabs is an AI-powered data visualization platform that lets users query raw data, build interactive visuals, and generate outputs such as charts, slides, and document-ready files using plain-English prompts.
The source materials emphasize non-technical and business users, including teams that want to analyze spreadsheets, PDFs, and documents without using SQL, Python, or Excel formulas.
The pricing page shows a 7-day free trial on the Starter plan, with monthly and annual billing options. The annual option advertises a 10% savings.
The public pages mention connectors or tools such as Google Sheets, Excel, CSV, PDF, Notion, Slack, HubSpot, Salesforce, Airtable, Postgres, Stripe, and Gmail, but the data-sources page also says source support is coming soon, so the exact connector availability should be checked before purchase.
The site presents OrangeLabs as useful for building visuals, creating data UI, generating slides, and supporting analytics workflows, but it does not provide detailed implementation steps or export specifications on the public pages.

PromptScout tracks how ChatGPT, Gemini, Google AI Overviews, and Perplexity mention your brand or competitors, then pairs those results with source analysis and website audits. It helps teams decide what to fix in content, positioning, or site readiness next.

SaveMRR is a Stripe retention tool for SaaS teams that scans billing data for churn and MRR leaks, then automates recovery through dunning, cancel-save offers, win-back emails, and onboarding nudges. It is built for founders and bootstrapped teams using Stripe.

Hype is a web tool for finding trending YouTube topics by category, time range, and scoring mode. It helps creators spot emerging ideas, inspect source videos, and decide what to cover next.

Sleek Analytics is a privacy-friendly web analytics tool with real-time visitor tracking, Core Web Vitals, and revenue attribution. It helps site owners understand traffic and conversions without cookie banners or a heavy setup.

Struere is an AI-native platform for turning spreadsheet data into structured operational software with dashboards, alerts, and automations. It is aimed at teams that want to replace manual spreadsheet workflows without building custom tools from scratch.

ClayHog ist eine KI-Sichtbarkeitsplattform für die Suche, die zeigt, wie Marken in ChatGPT, Gemini, Perplexity, Claude und Google AI Overviews erscheinen.