
Congressional trade database
Browse disclosed transactions from House and Senate members, with filters for buys or sells, chamber, party, member status, and selected periods.

Congress Trades is a web application for searching public stock and securities disclosures from U.S. House and Senate members. It helps researchers compare reported congressional trades and estimated performance with the S&P 500, while documenting the delays and assumptions in the underlying data.
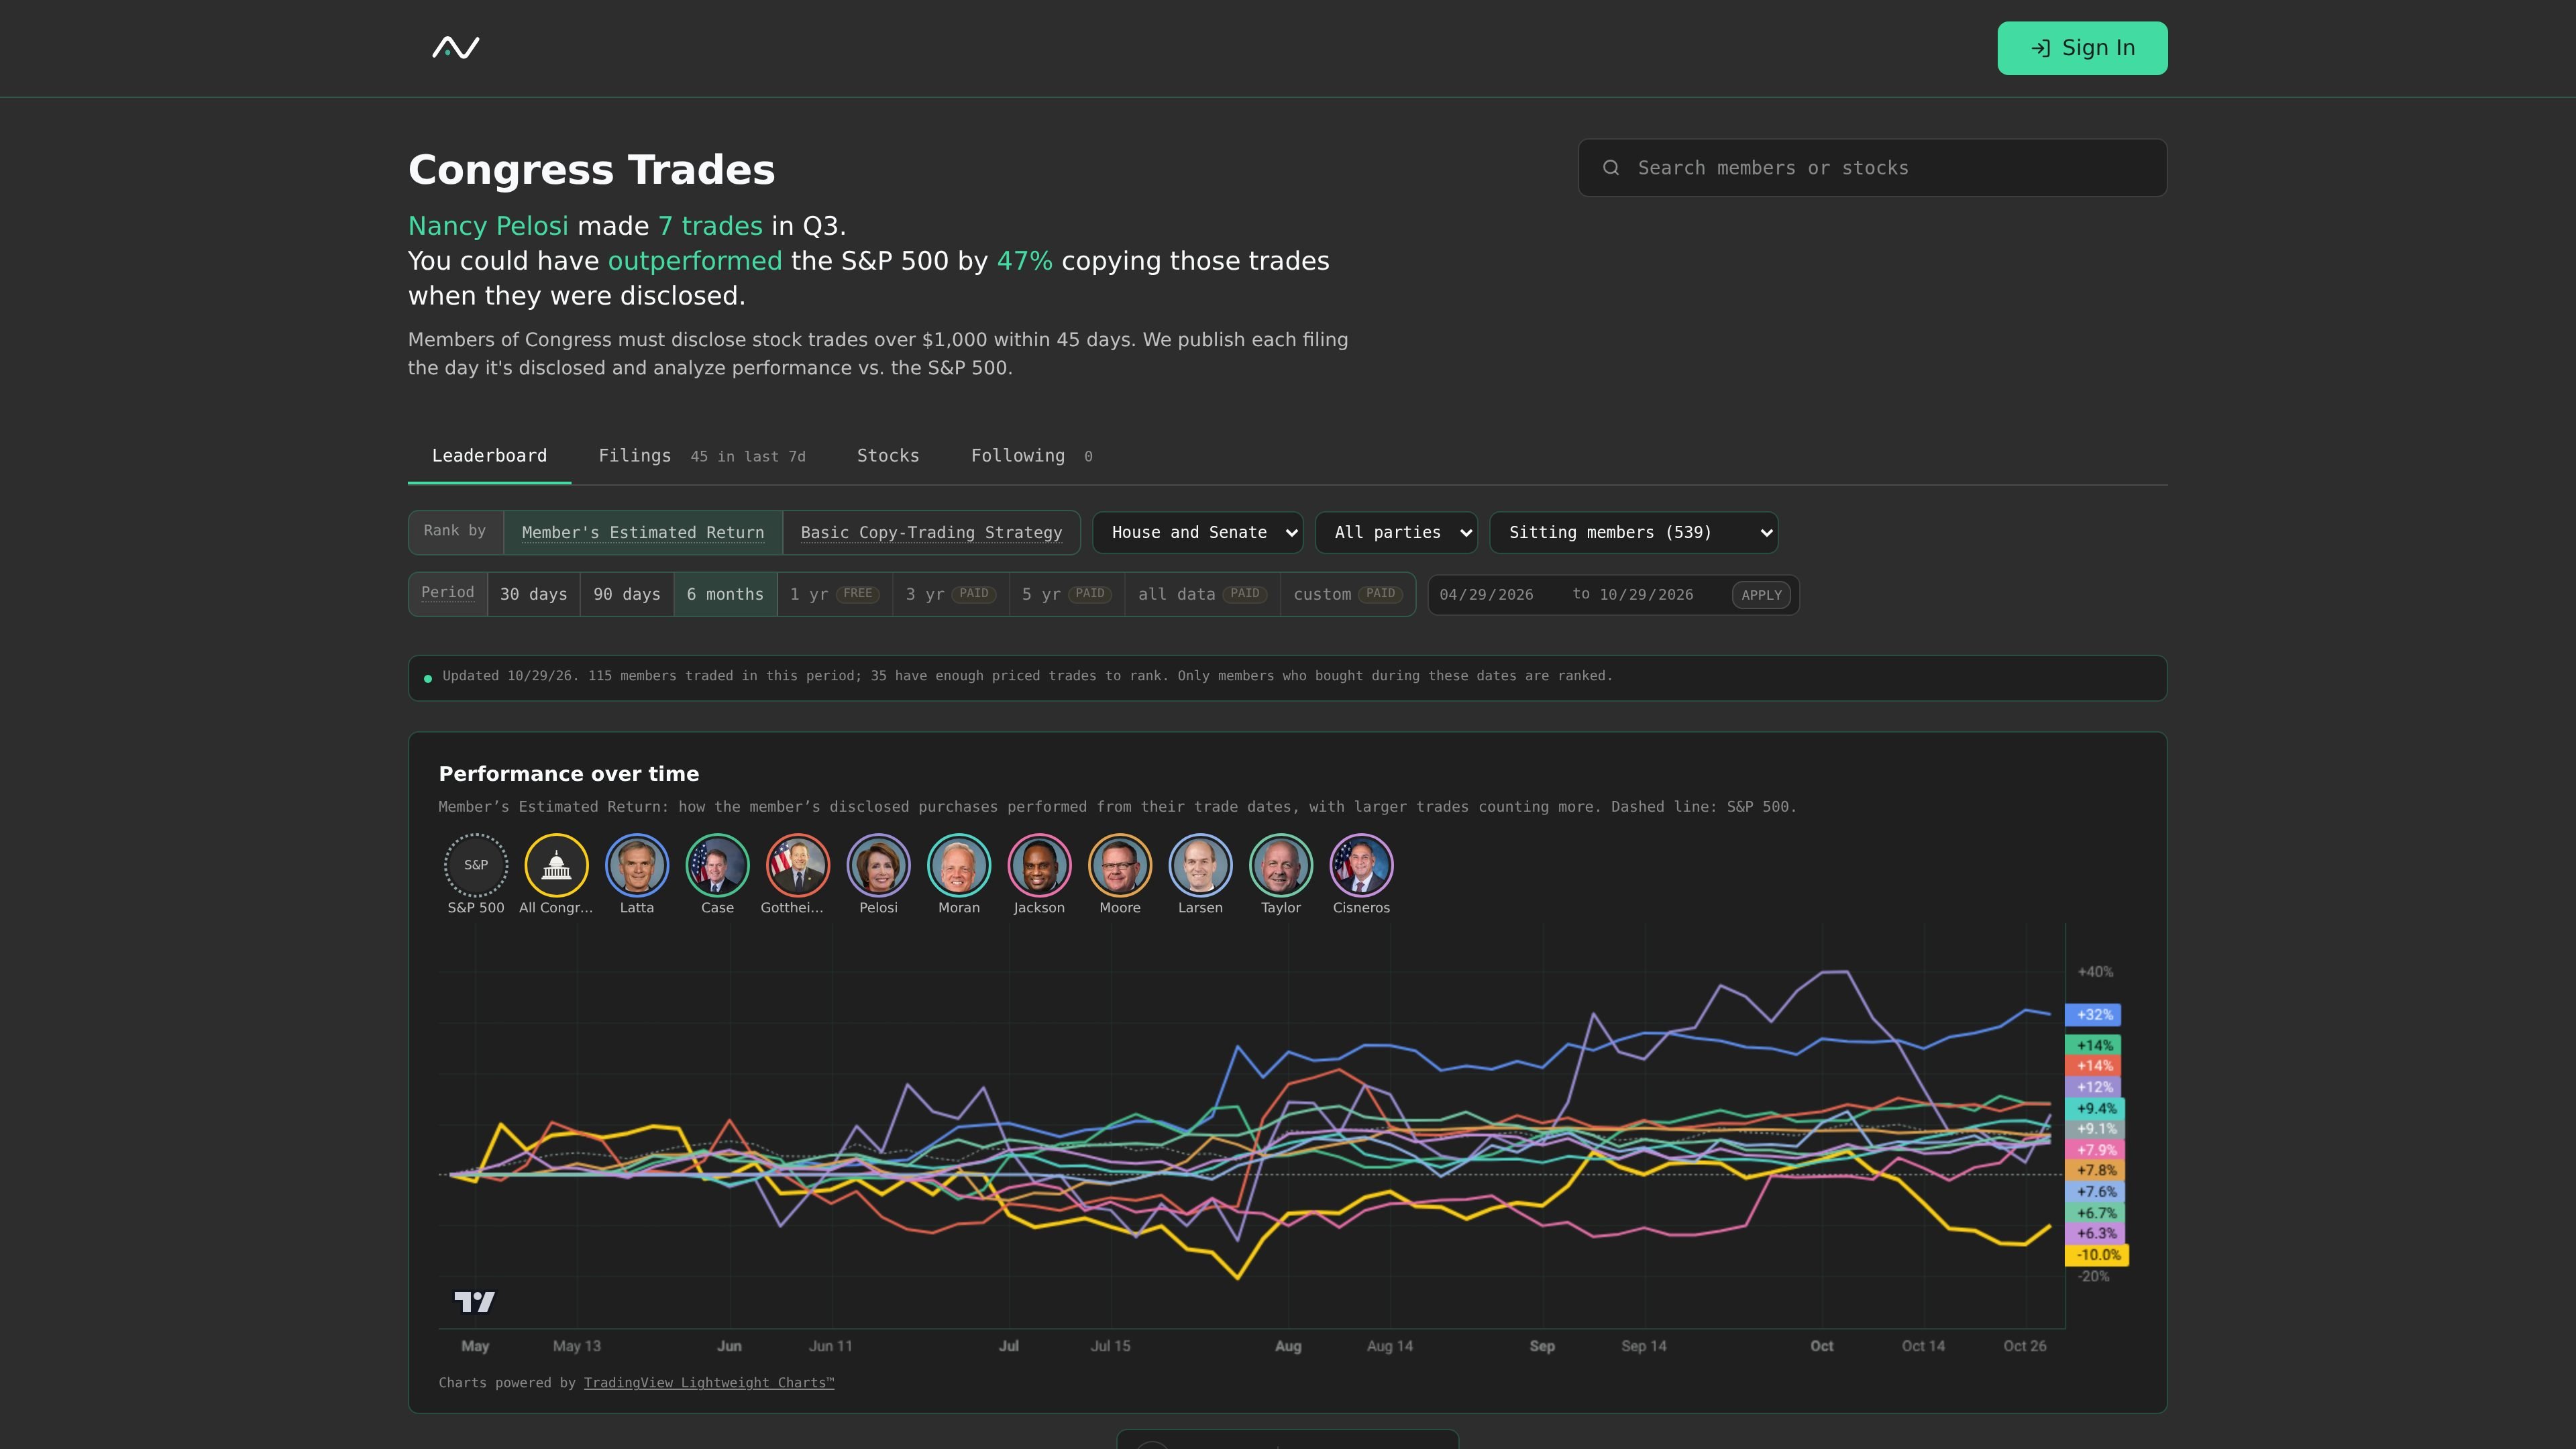
Congress Trades is a web-based tracker for publicly disclosed stock and other securities transactions by members of the U.S. House and Senate. It organizes filings into searchable trade and member views, showing what was reported, when the filing became public, the disclosed amount range, and links to the underlying House or Senate filing.
The service also analyzes selected purchases against the S&P 500 using two distinct approaches: a trade-date estimate of the member’s return and a disclosure-date strategy that models investing $1,000 per buy. Because congressional disclosures are retrospective and provide amount ranges rather than exact values, the results are estimates for research and comparison, not live signals or investment advice.
Browse disclosed transactions from House and Senate members, with filters for buys or sells, chamber, party, member status, and selected periods.
Review individual trades with filing time, member, ticker, company, action, disclosed amount range, performance, and a link to the source filing.
Explore rankings and charts by selected period, including Member’s Estimated Return, Basic Copy-Trading Strategy, win rate versus the S&P 500, and money traded.
Filter the stock view by sector and inspect which members traded a ticker, the number of disclosed trades, and buy-versus-sell counts.
Follow members and receive alerts; the site states that paid subscriptions include unlimited follows, while free accounts have a limited number.
Use separate trade-date and disclosure-date calculations, with ranges reflecting uncertainty in reported transaction amounts.
Search a member’s disclosed purchases and sales, inspect the associated filing, and review how qualifying positions performed relative to the S&P 500.
Use the stock and sector views to identify securities traded by multiple members and compare buy-versus-sell activity across the selected period.
Compare the trade-date estimate with the disclosure-date copy-trading model to separate retrospective member performance from a strategy that only acts after public disclosure.
Follow selected members to monitor new disclosures and use alerts where supported by the subscription plan.
Congress Trades uses public House and Senate disclosures. Members generally report qualifying trades after the fact, often weeks later, so the service is not a live trading signal.
The site publishes disclosed filings and provides trade, filing-time, amount-range, and performance information. It also links records back to the relevant House or Senate filing.
The site compares two separate calculations with the S&P 500: Member’s Estimated Return starts from the trade date, while the Basic Copy-Trading Strategy starts from the disclosure date and models investing $1,000 for each buy and selling the position when the member sells.
Amounts are shown as ranges because congressional disclosures do not provide exact transaction values. Trades that cannot be priced are excluded from return calculations, and options may be represented using the underlying stock as a simplified signal.
A free account provides limited access, including up to one year of history, the first 25 results, and up to three follows. Paid access is described as providing all available data, custom date ranges, every result, and unlimited follows with alerts.