
Ask Genie questions about performance
Ask questions in natural language and get clear, visual answers grounded in the metrics and dashboards already in Databox. Genie is positioned as an AI analyst rather than a standalone chat tool.

Databox AI is an analytics layer for asking performance questions in plain language and getting answers grounded in connected business metrics. It helps teams analyze data, summarize changes, and use trusted Databox metrics inside external AI tools.
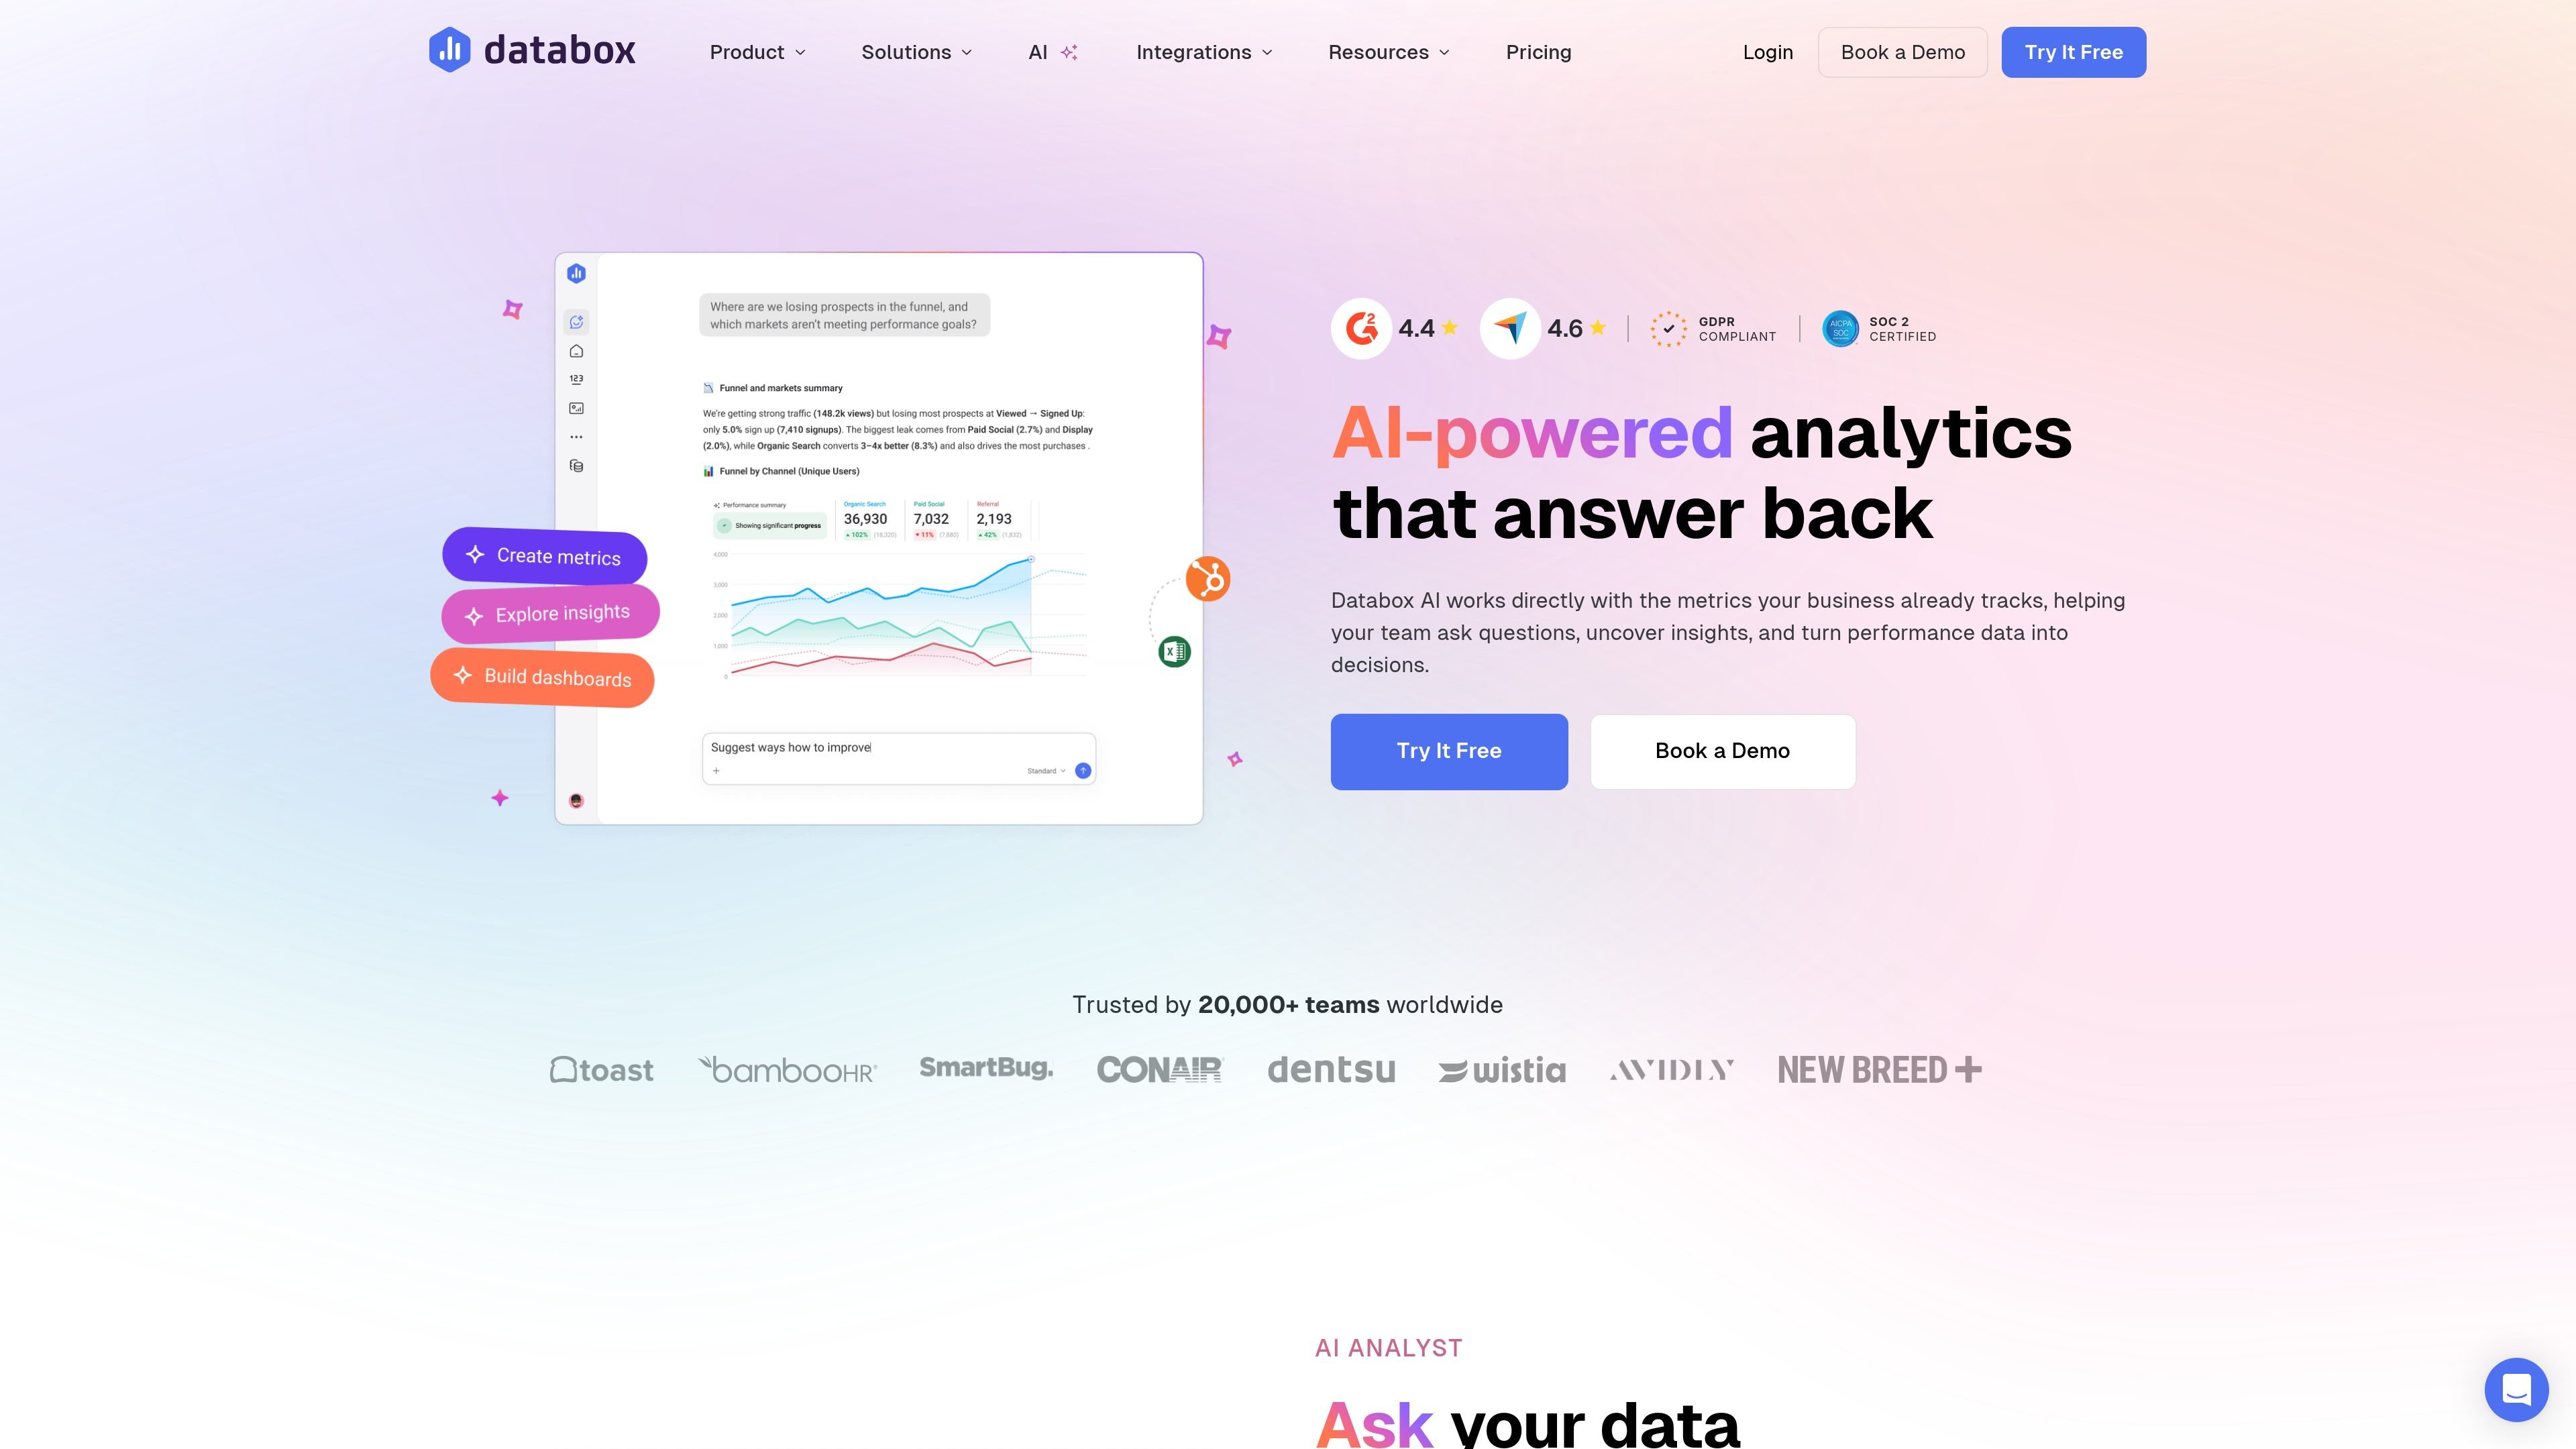
Databox AI is an analytics product built for teams that want to ask business questions in plain language and get answers grounded in the metrics they already track. The experience centers on Genie, an AI analyst that can explain performance, build dashboards or metrics from prompts, and return visual answers without requiring users to dig through dashboards manually.
The product also includes AI Performance Summaries and Databox MCP. Performance summaries automatically interpret changes across metrics, while MCP connects Databox data to external AI tools such as Claude, n8n, and ChatGPT so teams can analyze data and trigger workflows inside tools they already use. Databox positions the AI features on top of its existing datasets, metric builder, dashboards, and 130+ integrations.
Ask questions in natural language and get clear, visual answers grounded in the metrics and dashboards already in Databox. Genie is positioned as an AI analyst rather than a standalone chat tool.
Describe what you want to see and Genie can create the underlying metrics, charts, and dashboards from a prompt, reducing manual setup work.
Databox’s AI Performance Summaries automatically review performance data and produce written summaries of the most important changes, plus recommendations on what to focus on next.
Databox MCP lets you use Databox data inside AI tools such as Claude, n8n, and ChatGPT so teams can analyze data and trigger workflows without opening a dashboard.
Databox’s datasets, metric builder, and dashboards provide the structured data layer behind the AI features, helping keep answers tied to defined metrics and business context.
Users can share Genie conversations by link and distribute dashboards or reports through secure links, embeds, TV streams, snapshots, alerts, and Slack updates.
Executives can ask questions such as why revenue dropped or what changed last month and get a concise explanation without opening multiple dashboards.
Functional leaders can combine metrics across pipeline, revenue, growth, or channel performance to spot trends and anomalies before they become reporting problems.
Business analysts can let stakeholders ask their own questions while the analyst focuses on deeper modeling, metric design, and strategy work.
Agencies and consultants can review campaign, account, or pipeline changes before client meetings and share the resulting insights with confidence.
Teams building AI-assisted workflows can connect Databox through MCP to tools like ChatGPT or Claude and use trusted metrics inside automation or analysis workflows.
Databox AI is an AI-powered analytics layer inside Databox that lets you ask questions about performance data, generate charts and dashboards from prompts, and get AI performance summaries. Genie is the AI analyst experience, and Databox MCP connects Databox data to external AI tools.
The source materials show Databox working with more than 130 integrations and supporting cloud tools, spreadsheets, SQL and NoSQL databases, custom integrations, APIs, and Databox API workflows. Examples mentioned include HubSpot, Salesforce, and Google Analytics 4.
Databox says Genie can answer questions in plain language, create dashboards or metrics from prompts, and return clear visual answers with context from your metrics and dashboards. Databox also offers AI Performance Summaries that explain what changed and why.
Yes. The home page says Genie conversations can be shared with teammates using a link. Databox also supports sharing dashboards and reports through secure links, embeds, TV streams, and scheduled notifications.
Databox offers a free plan and paid plans on its pricing page. The free plan includes limited AI credits, data sources, dashboards, and custom metrics, while higher plans add more credits, users, integrations, and feature access.

PromptScout tracks how ChatGPT, Gemini, Google AI Overviews, and Perplexity mention your brand or competitors, then pairs those results with source analysis and website audits. It helps teams decide what to fix in content, positioning, or site readiness next.

SaveMRR is a Stripe retention tool for SaaS teams that scans billing data for churn and MRR leaks, then automates recovery through dunning, cancel-save offers, win-back emails, and onboarding nudges. It is built for founders and bootstrapped teams using Stripe.

Hype is a web tool for finding trending YouTube topics by category, time range, and scoring mode. It helps creators spot emerging ideas, inspect source videos, and decide what to cover next.

Sleek Analytics is a privacy-friendly web analytics tool with real-time visitor tracking, Core Web Vitals, and revenue attribution. It helps site owners understand traffic and conversions without cookie banners or a heavy setup.

Struere is an AI-native platform for turning spreadsheet data into structured operational software with dashboards, alerts, and automations. It is aimed at teams that want to replace manual spreadsheet workflows without building custom tools from scratch.

Инструмент на основе ИИ, который быстро и эффективно суммирует PDF-документы, предоставляя четкие идеи и позволяя пользователям взаимодействовать с содержимым.