InfoBlog
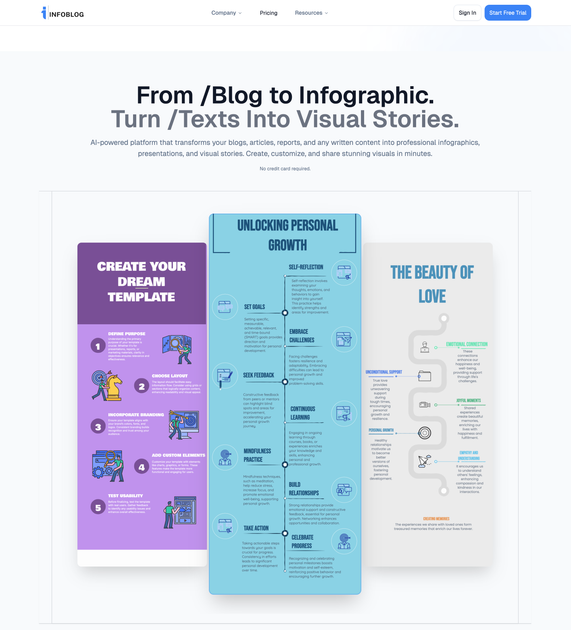
InfoBlog is an AI-powered platform designed to instantly transform written content, such as blogs, articles, and reports, into professional infographics, presentations, and compelling visual stories.
What is InfoBlog?
What is InfoBlog?
InfoBlog is a revolutionary content transformation platform leveraging advanced Artificial Intelligence to bridge the gap between dense textual information and engaging visual communication. In today's fast-paced digital landscape, capturing audience attention requires more than just well-written content; it demands immediate visual impact. InfoBlog solves this challenge by automating the complex process of content visualization, taking raw text input and intelligently structuring it into polished, ready-to-share visual assets.
This platform is essential for content marketers, educators, business analysts, and anyone struggling to repurpose long-form content efficiently. By eliminating the need for manual design work or hiring specialized graphic artists for every piece of content, InfoBlog democratizes high-quality visual storytelling, ensuring your key messages resonate clearly and quickly across all digital channels. It turns hours of design work into mere minutes of AI processing.
Key Features
InfoBlog stands out with a suite of powerful features engineered for speed, accuracy, and creative flexibility:
- AI-Powered Content Analysis: Utilizes sophisticated NLP models to identify key arguments, statistics, and narrative flow within any uploaded text (blogs, PDFs, reports).
- Instant Visual Generation: Automatically generates multiple visual formats, including detailed infographics, slide-deck presentations, and short visual summaries.
- Customizable Templates: Offers a vast library of professionally designed, industry-specific templates that users can easily adapt to match their brand guidelines.
- Drag-and-Drop Editor: Provides intuitive post-generation editing capabilities, allowing users to fine-tune layouts, swap icons, adjust color palettes, and modify text placement without needing design expertise.
- Data Visualization Integration: Seamlessly converts numerical data points extracted from the source material into appropriate charts, graphs, and data visualizations.
- Multi-Format Export: Supports high-resolution exports in common formats like PNG, JPG, PDF, and embeddable HTML, optimized for web, social media, and print.
- Brand Kit Synchronization: Allows users to upload and save specific brand colors, fonts, and logos for consistent output across all generated visuals.
How to Use InfoBlog
Getting started with InfoBlog is a straightforward, three-step process designed for maximum efficiency:
- Input Your Content: Begin by pasting your article text directly into the platform, uploading a document (PDF, DOCX), or providing a URL link to the existing blog post you wish to visualize. The AI immediately begins scanning and structuring the information.
- Select Format and Template: Choose the desired output format—Infographic, Presentation, or Visual Story. Browse the template library and select a starting design that aligns with your content's tone or industry. The AI will populate the template with the analyzed content.
- Review, Customize, and Export: Review the AI-generated visual. Use the intuitive drag-and-drop editor to make minor adjustments, swap out generic icons for specific ones, or refine the narrative flow. Once satisfied, select your desired resolution and export the final asset for immediate distribution.
Use Cases
InfoBlog is versatile and provides significant value across numerous professional contexts:
- Content Repurposing for Marketing Teams: Quickly transform a successful 3,000-word white paper into a shareable, 10-slide presentation for LinkedIn and an infographic for Pinterest, maximizing the ROI of original research.
- Educational Material Creation: Teachers and corporate trainers can convert lengthy lesson plans or technical manuals into visually engaging study guides or onboarding presentations, improving learner retention.
- Internal Reporting and Analysis: Business analysts can take complex quarterly reports filled with data and instantly generate executive summaries in infographic format, making complex findings accessible to non-technical stakeholders.
- Blogging and SEO Enhancement: Bloggers can create stunning featured images or in-post visual summaries that break up text, increasing time-on-page metrics and reducing bounce rates.
- Sales Enablement: Sales professionals can rapidly customize pitch decks based on client needs by feeding InfoBlog relevant case studies, ensuring every presentation is visually compelling and data-backed.
FAQ
Q: What types of content can InfoBlog process? A: InfoBlog handles virtually any written format, including blog posts, articles, research papers, transcripts, meeting notes, and standard text documents (TXT, DOCX, PDF). The AI excels at extracting structure from dense material.
Q: Is a design background required to use the platform effectively? A: Absolutely not. InfoBlog is built for non-designers. While the AI handles the heavy lifting, the post-generation editor uses simple drag-and-drop functionality, making customization accessible to everyone.
Q: Can I use my company's specific fonts and color schemes? A: Yes. The Brand Kit feature allows you to upload and save your corporate identity assets. All generated visuals will automatically adhere to these saved specifications for brand consistency.
Q: What are the export options available? A: You can export your visuals in high-resolution PNG and JPG formats, suitable for web and social media. PDF exports are available for print-ready documents, and some plans offer embeddable HTML code for direct website integration.
Q: How does InfoBlog handle data accuracy during visualization? A: The AI cross-references numerical data points found in the text and intelligently selects the most appropriate chart type (bar, pie, line). Users are always prompted to review the data mapping before final export to ensure 100% accuracy.
Alternatives
Napkin AI
Napkin AI transforms your text into insightful visuals, making communication more effective and engaging.
Palette
Generate a custom Tailwind color palette from a prompt.
okkslides
Create stunning presentations with okk AI slides maker. Transform ideas into professional PowerPoint slides in minutes.
创客贴 AI
创客贴 AI is an AI-powered design platform that includes various AI design tools to help users reduce design complexity and enhance design efficiency.
Kittl
Kittl is an AI-first design platform that empowers creators to produce standout branding and product visuals quickly and efficiently.
Slidesgo
Slidesgo offers a wide variety of free Google Slides themes and PowerPoint templates for presentations.