
Tool analytics
Track tool calls, ranking, and trends over time so you can see which tools are used most and how adoption changes.

TrackMCP is an analytics and observability tool for MCP servers. It helps teams see which clients and tools are being used, where workflows fail or stall, and what to improve next.
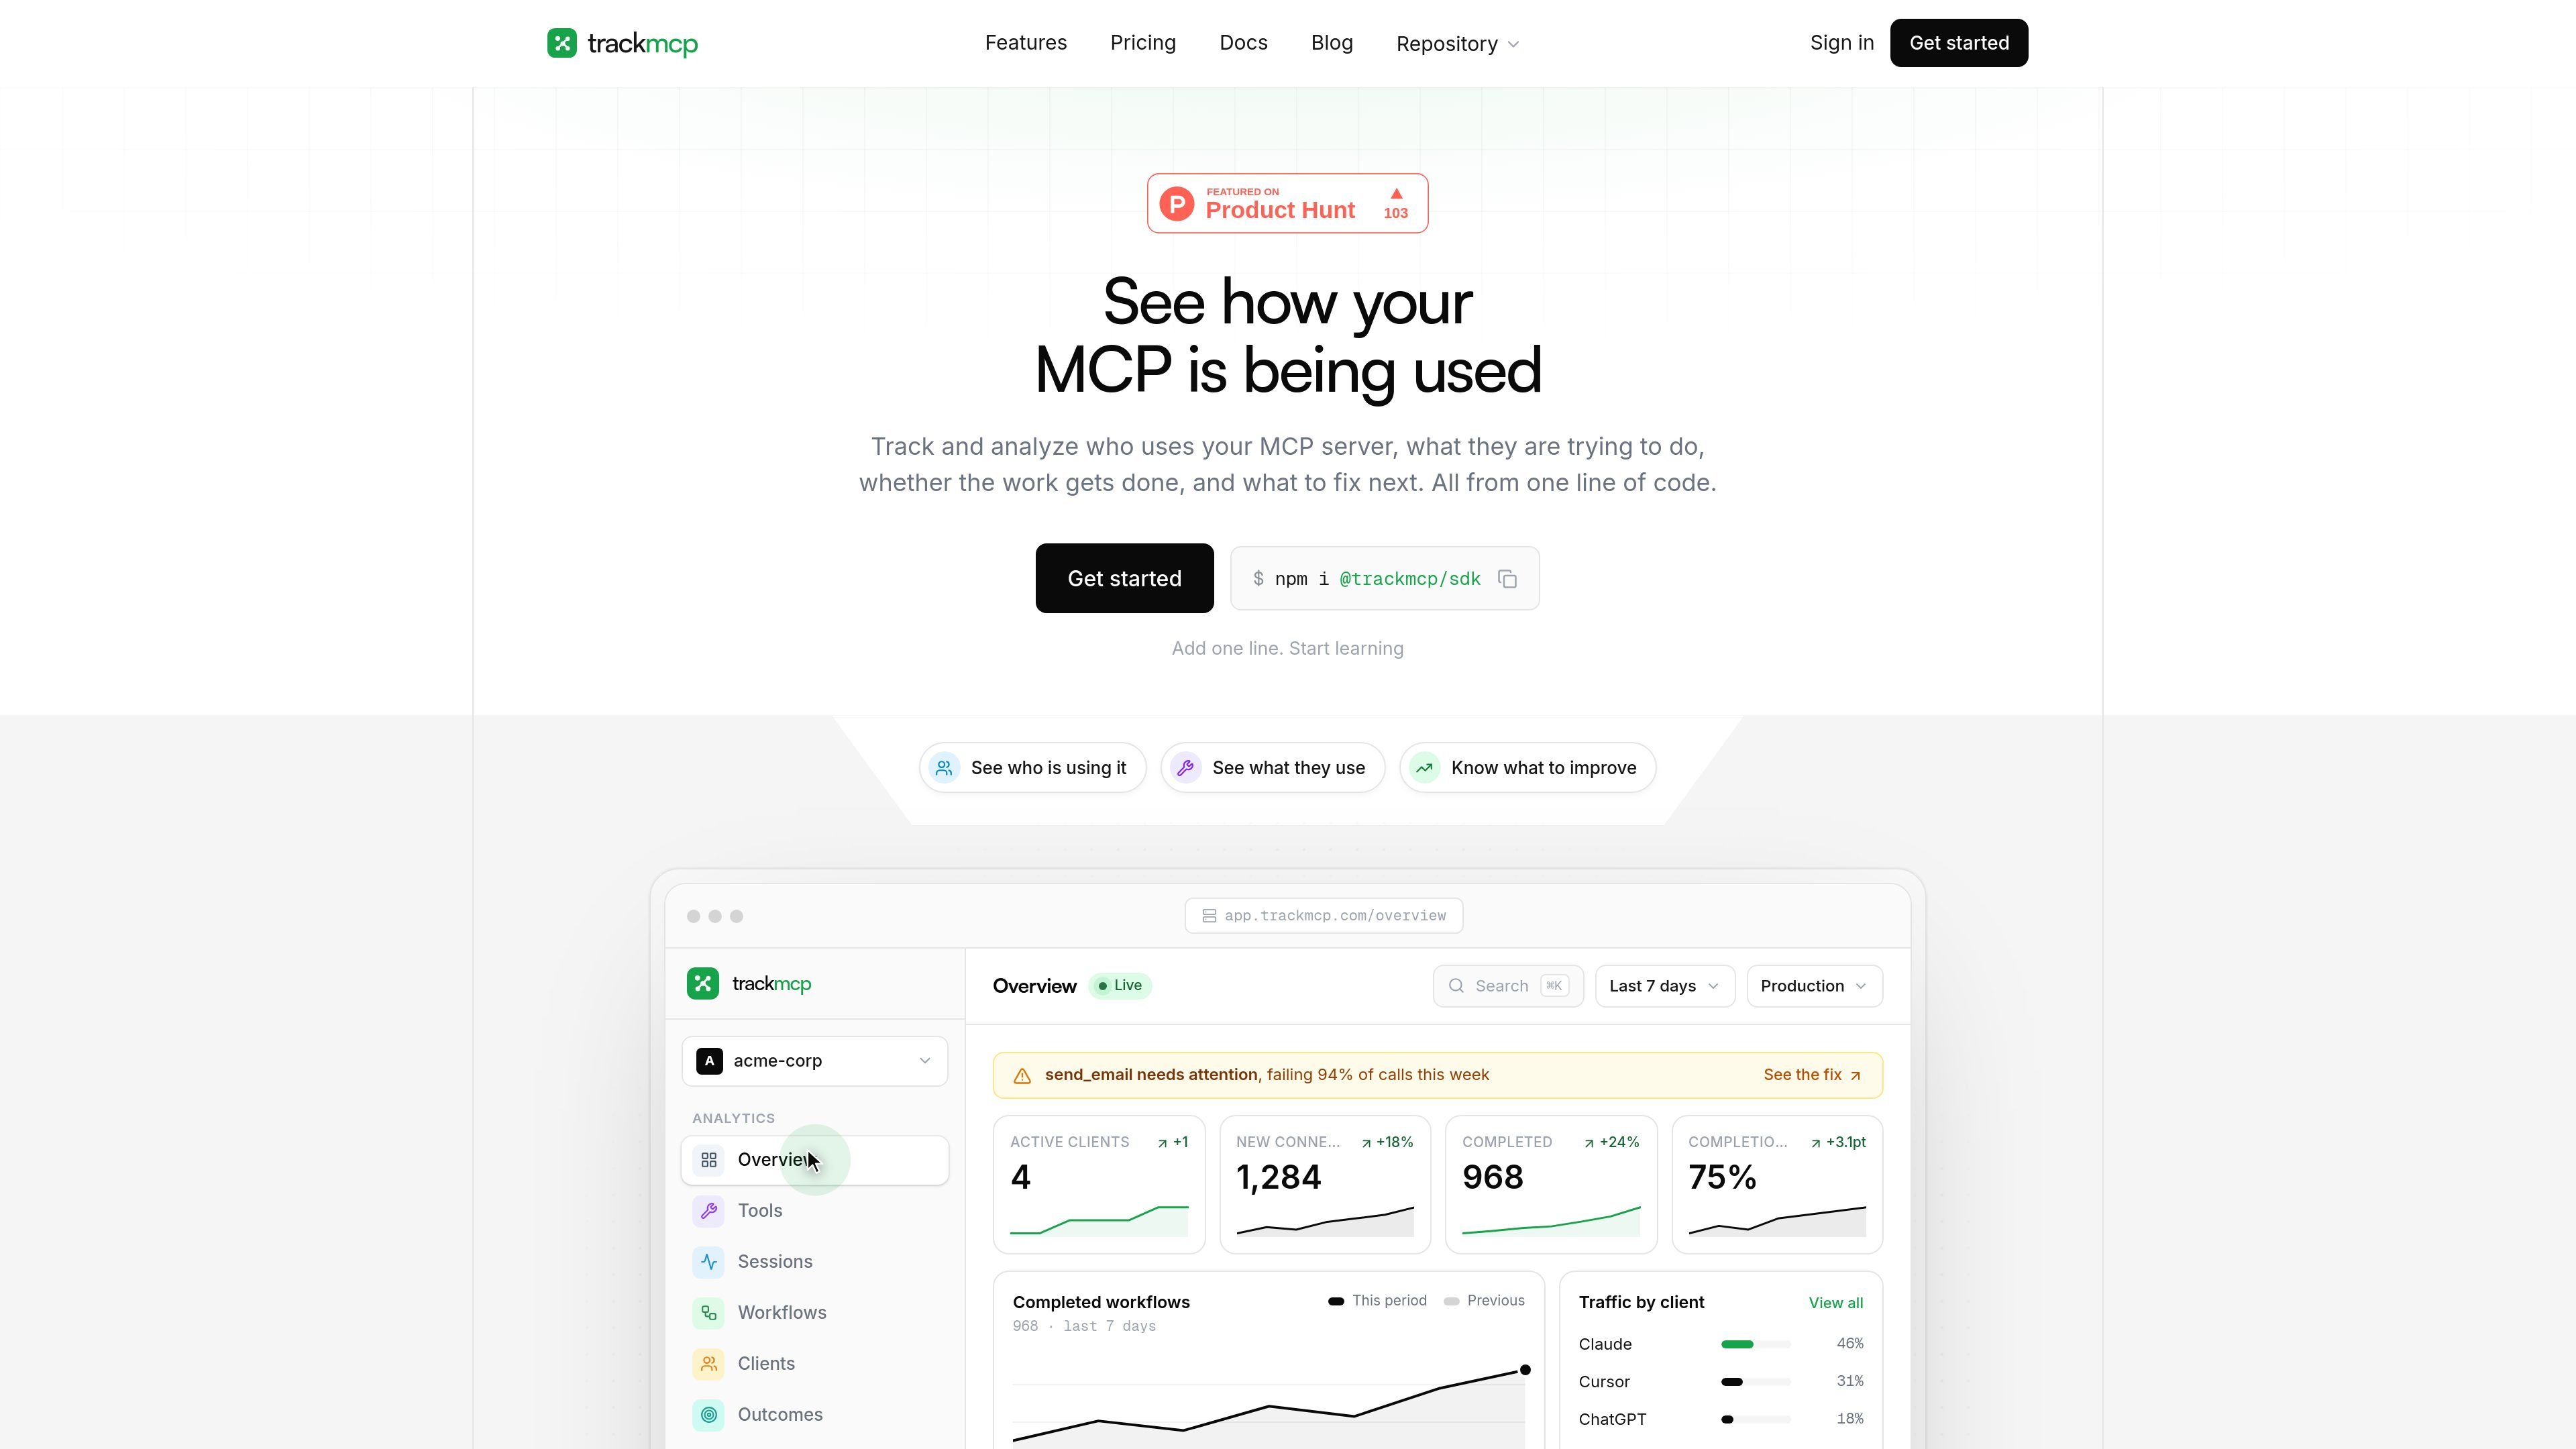
TrackMCP is an analytics and observability layer for MCP servers. It wraps an existing MCP server at the server boundary and turns protocol traffic into usage, reliability, and workflow signals without changing the tool implementations.
The product is designed to show who is using a server, which tools they call, where sessions stop, and what needs attention next. It supports TypeScript and Python SDKs, captures telemetry in real time, and is set up with a one-line wrapper and a workspace key.
Track tool calls, ranking, and trends over time so you can see which tools are used most and how adoption changes.
See latency and error-rate profiles per tool, including p50 and p95 latency, to identify slow or flaky calls.
Detect failures that appear as a successful HTTP 200 response but contain tool errors in the payload, including isError responses.
Open any call to inspect arguments, results, timing, client, and error details in one record.
Break usage down by client, replay sessions, and see where workflows stall or drop off before completion.
Receive plain-English insights plus alerts and integrations such as email, Slack, webhooks, REST API access, CSV export, and OpenTelemetry export.
Use TrackMCP to see which AI clients connect to your server, how usage is distributed across Claude, Cursor, ChatGPT, and custom agents, and whether returning usage is growing.
Use the latency, error, and silent-failure views to find tools that are slow, flaky, or returning tool errors inside otherwise successful responses.
Replay sessions and inspect calls to understand where users or agents stop in a workflow, then identify the tool or schema issue that caused the drop-off.
Use the analytics and zero-call tool views to identify low-value tools, dead tools, and schema areas that may be unused or misconfigured.
Use alerts, webhooks, REST access, and exports to feed MCP telemetry into existing operational workflows and external systems.
TrackMCP wraps an existing MCP server at the server boundary and records tool calls, sessions, clients, errors, and outcomes. The docs say data appears in the dashboard after the first telemetry flush and a real tool call.
Yes. The pricing page lists both TypeScript and Python SDK support, and the docs show a one-line wrapper for each.
No. The source says you wrap your existing MCP server once with the SDK and keep your tool implementations unchanged.
TrackMCP offers a free Hobby plan, a paid Pro plan, and an Enterprise plan with custom pricing. The Hobby plan includes 1,000 captured tool calls per month, while Pro includes 50,000 captured tool calls per month.
The pricing page says telemetry is stored in managed Postgres infrastructure, and Enterprise customers can discuss retention, export, and deployment requirements before signing.

ClawTick is an AI agent automation platform for scheduling jobs from the CLI, dashboard, or REST API. It is aimed at developers and teams running LangChain, CrewAI, webhook, or custom agent workflows that need monitoring, alerts, and logs.

OpenFlags is an open-source, self-hosted feature flag platform for modern JavaScript teams. It supports local evaluation, targeted rollouts, and controlled launches while keeping flag data in your own infrastructure.

ByteAsk is a terminal-first AI coding agent for C and C++ that edits repositories and verifies changes with the real compiler, debugger, sanitizers, and tests before showing a diff. It offers a free tier plus paid plans, with editor connectors and zero-retention handling described in the source.

PromptScout tracks how ChatGPT, Gemini, Google AI Overviews, and Perplexity mention your brand or competitors, then pairs those results with source analysis and website audits. It helps teams decide what to fix in content, positioning, or site readiness next.

CreateOS Sandbox is an isolated compute environment for running code and agent workloads inside Firecracker micro-VMs. It is designed for workflows that need machine-level isolation, private networking between sandboxes, and programmatic control through SDK, CLI, or MCP.

Sleek Analytics is a privacy-friendly web analytics tool with real-time visitor tracking, Core Web Vitals, and revenue attribution. It helps site owners understand traffic and conversions without cookie banners or a heavy setup.