StatusStats
StatusStats is a macOS menu bar system monitor showing live CPU, GPU, memory, thermals & fans, network, power, storage and battery metrics.
What is StatusStats?
StatusStats is a macOS menu bar system monitor showing live CPU, GPU, memory, thermals & fans, network, power, storage, and battery metrics at a glance.
Its core purpose is quick, ongoing visibility: the app is designed to “live in your menu bar,” providing compact history (sparklines) and real-time values across multiple system subsystems.
Key Features
- Menu bar monitoring for multiple subsystems: Displays CPU, GPU, memory, thermals & fans, network, power, storage, and battery directly in the macOS menu bar.
- CPU usage with temperature history: Shows CPU usage alongside temperature and includes sparkline history for quick trend checking.
- Real-time GPU metrics: Presents GPU utilization and GPU temperature updated in real time.
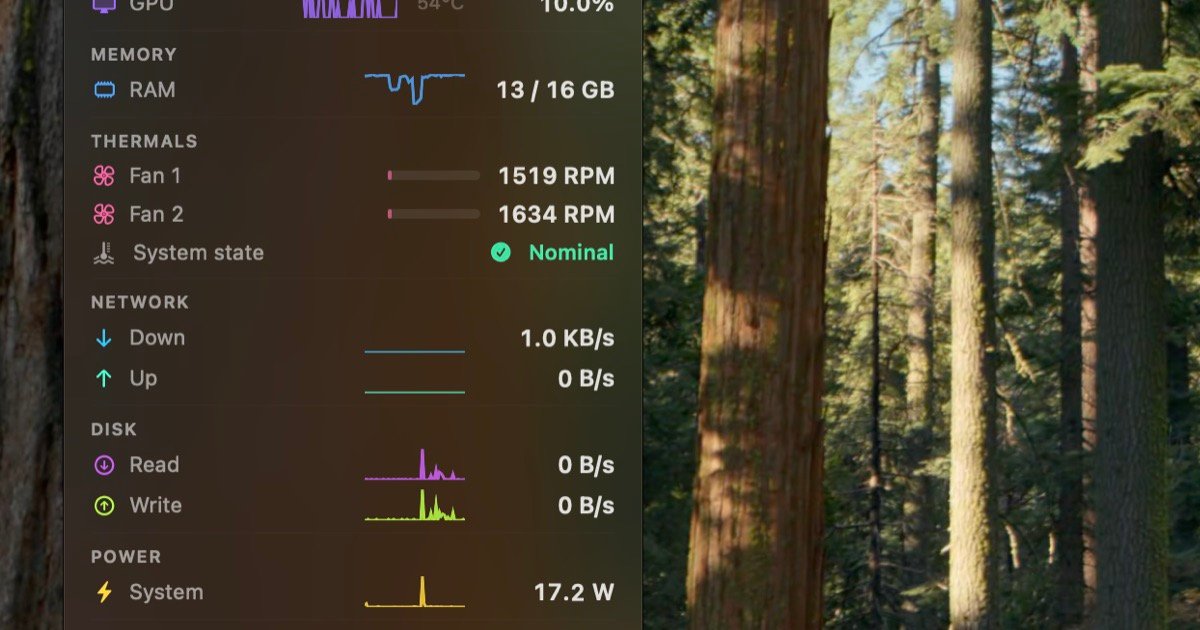
- Memory usage with pressure indicator: Tracks memory used versus total RAM and includes a memory pressure indicator.
- Thermals and fan details: Shows fan RPM, load bars, and the system thermal state.
- Network throughput: Displays live upload and download speed.
- Disk and storage metrics: Includes disk I/O read and write throughput plus storage used versus total disk capacity.
- Battery health and condition: Provides battery charge, health, cycle count, and battery temperature.
How to Use StatusStats
- Install StatusStats and open it to place the monitor in your macOS menu bar.
- Use the menu bar display to view the metrics you care about, including CPU/GPU usage and temperatures, memory usage, thermals, fan RPM, network speeds, disk I/O, power draw, storage capacity, and battery details.
- For longer-running observations, use the available history elements (such as sparkline views for CPU usage and temperature) to spot changes over time.
Use Cases
- Checking performance during demanding tasks: Monitor CPU and GPU utilization and their temperatures while running resource-heavy apps to see whether the system is heating up.
- Troubleshooting thermal behavior: Use thermals & fans (fan RPM, load bars, thermal state) to understand how cooling responds during sustained workloads.
- Understanding memory pressure: Review memory used vs total RAM and the memory pressure indicator to gauge whether the system is under memory strain.
- Tracking connectivity changes: Watch live upload and download speeds to confirm whether network performance is behaving as expected.
- Assessing storage and I/O activity: View disk I/O read/write throughput and compare storage used against total capacity during tasks that write or process large files.
FAQ
-
Which Macs and macOS versions are supported? StatusStats is listed as compatible with Apple Silicon & Intel Macs and macOS Ventura or later.
-
Where do I see the information? The app is designed to live in your menu bar, where it shows the selected metrics.
-
Is the data live or historical? Some values are described as updated in real time (for example, GPU utilization and temperature, and live network speeds). CPU usage and temperature also include sparkline history.
-
What pricing is available? The page lists a $3 one-time purchase and a 14-day free trial.
Alternatives
- Activity Monitor (built-in macOS): A native option for inspecting CPU, memory, disk, network, and energy/power-related information, though it typically requires opening a dedicated window rather than living in the menu bar.
- Third-party macOS system monitor apps with menu bar widgets: Category alternatives that also present system metrics in the menu bar; compare which subsystems they cover (e.g., thermals, fan RPM, battery health) and how they present history.
- Temperature/fan utilities: Apps focused primarily on thermals and fan behavior may provide deeper fan/temperature controls, but may not cover the full set of metrics (network, storage, battery health) shown by StatusStats.
Alternatives
FounderStackHub
FounderStackHub uses an always-on AI agent to scan, verify, and match startup perks like cloud credits, AI-tool credits, and SaaS discounts to your stack.
Elvixs
Elvixs is an AI job outreach tool for freshers and students—find HR contacts, generate AI cold emails, send from Gmail, and track opens.
Gossipic
Gossipic tracks how often your brand is mentioned in AI answers, analyzes sentiment, benchmarks competitors, and creates daily action plans. Start 7-day free trial.
SnapSub: Subscriptions Hub
SnapSub: Subscriptions Hub centralizes recurring services so you can track what you pay, upcoming billing dates, and get reports to review spending.
Abakada
Abakada is the Philippines’ curated directory of free, open-source tools—1,000+ verified listings across 45+ categories for students & educators.
Been There Global
Been There Global shares real stories from real travellers to help you “know before you go” and plan trips with more confidence.