
Trace and observe agent workflows
See execution paths across prompts, models, tools, retrieval steps, latency, token usage, and outputs so you can follow a multi-step AI run from start to finish.

Progress Telerik’s AI Observability Platform helps teams trace, debug, analyze cost, and evaluate AI agent workflows across production runs. It supports .NET, Python, and JavaScript and is positioned for developers, engineering leaders, and enterprise teams.
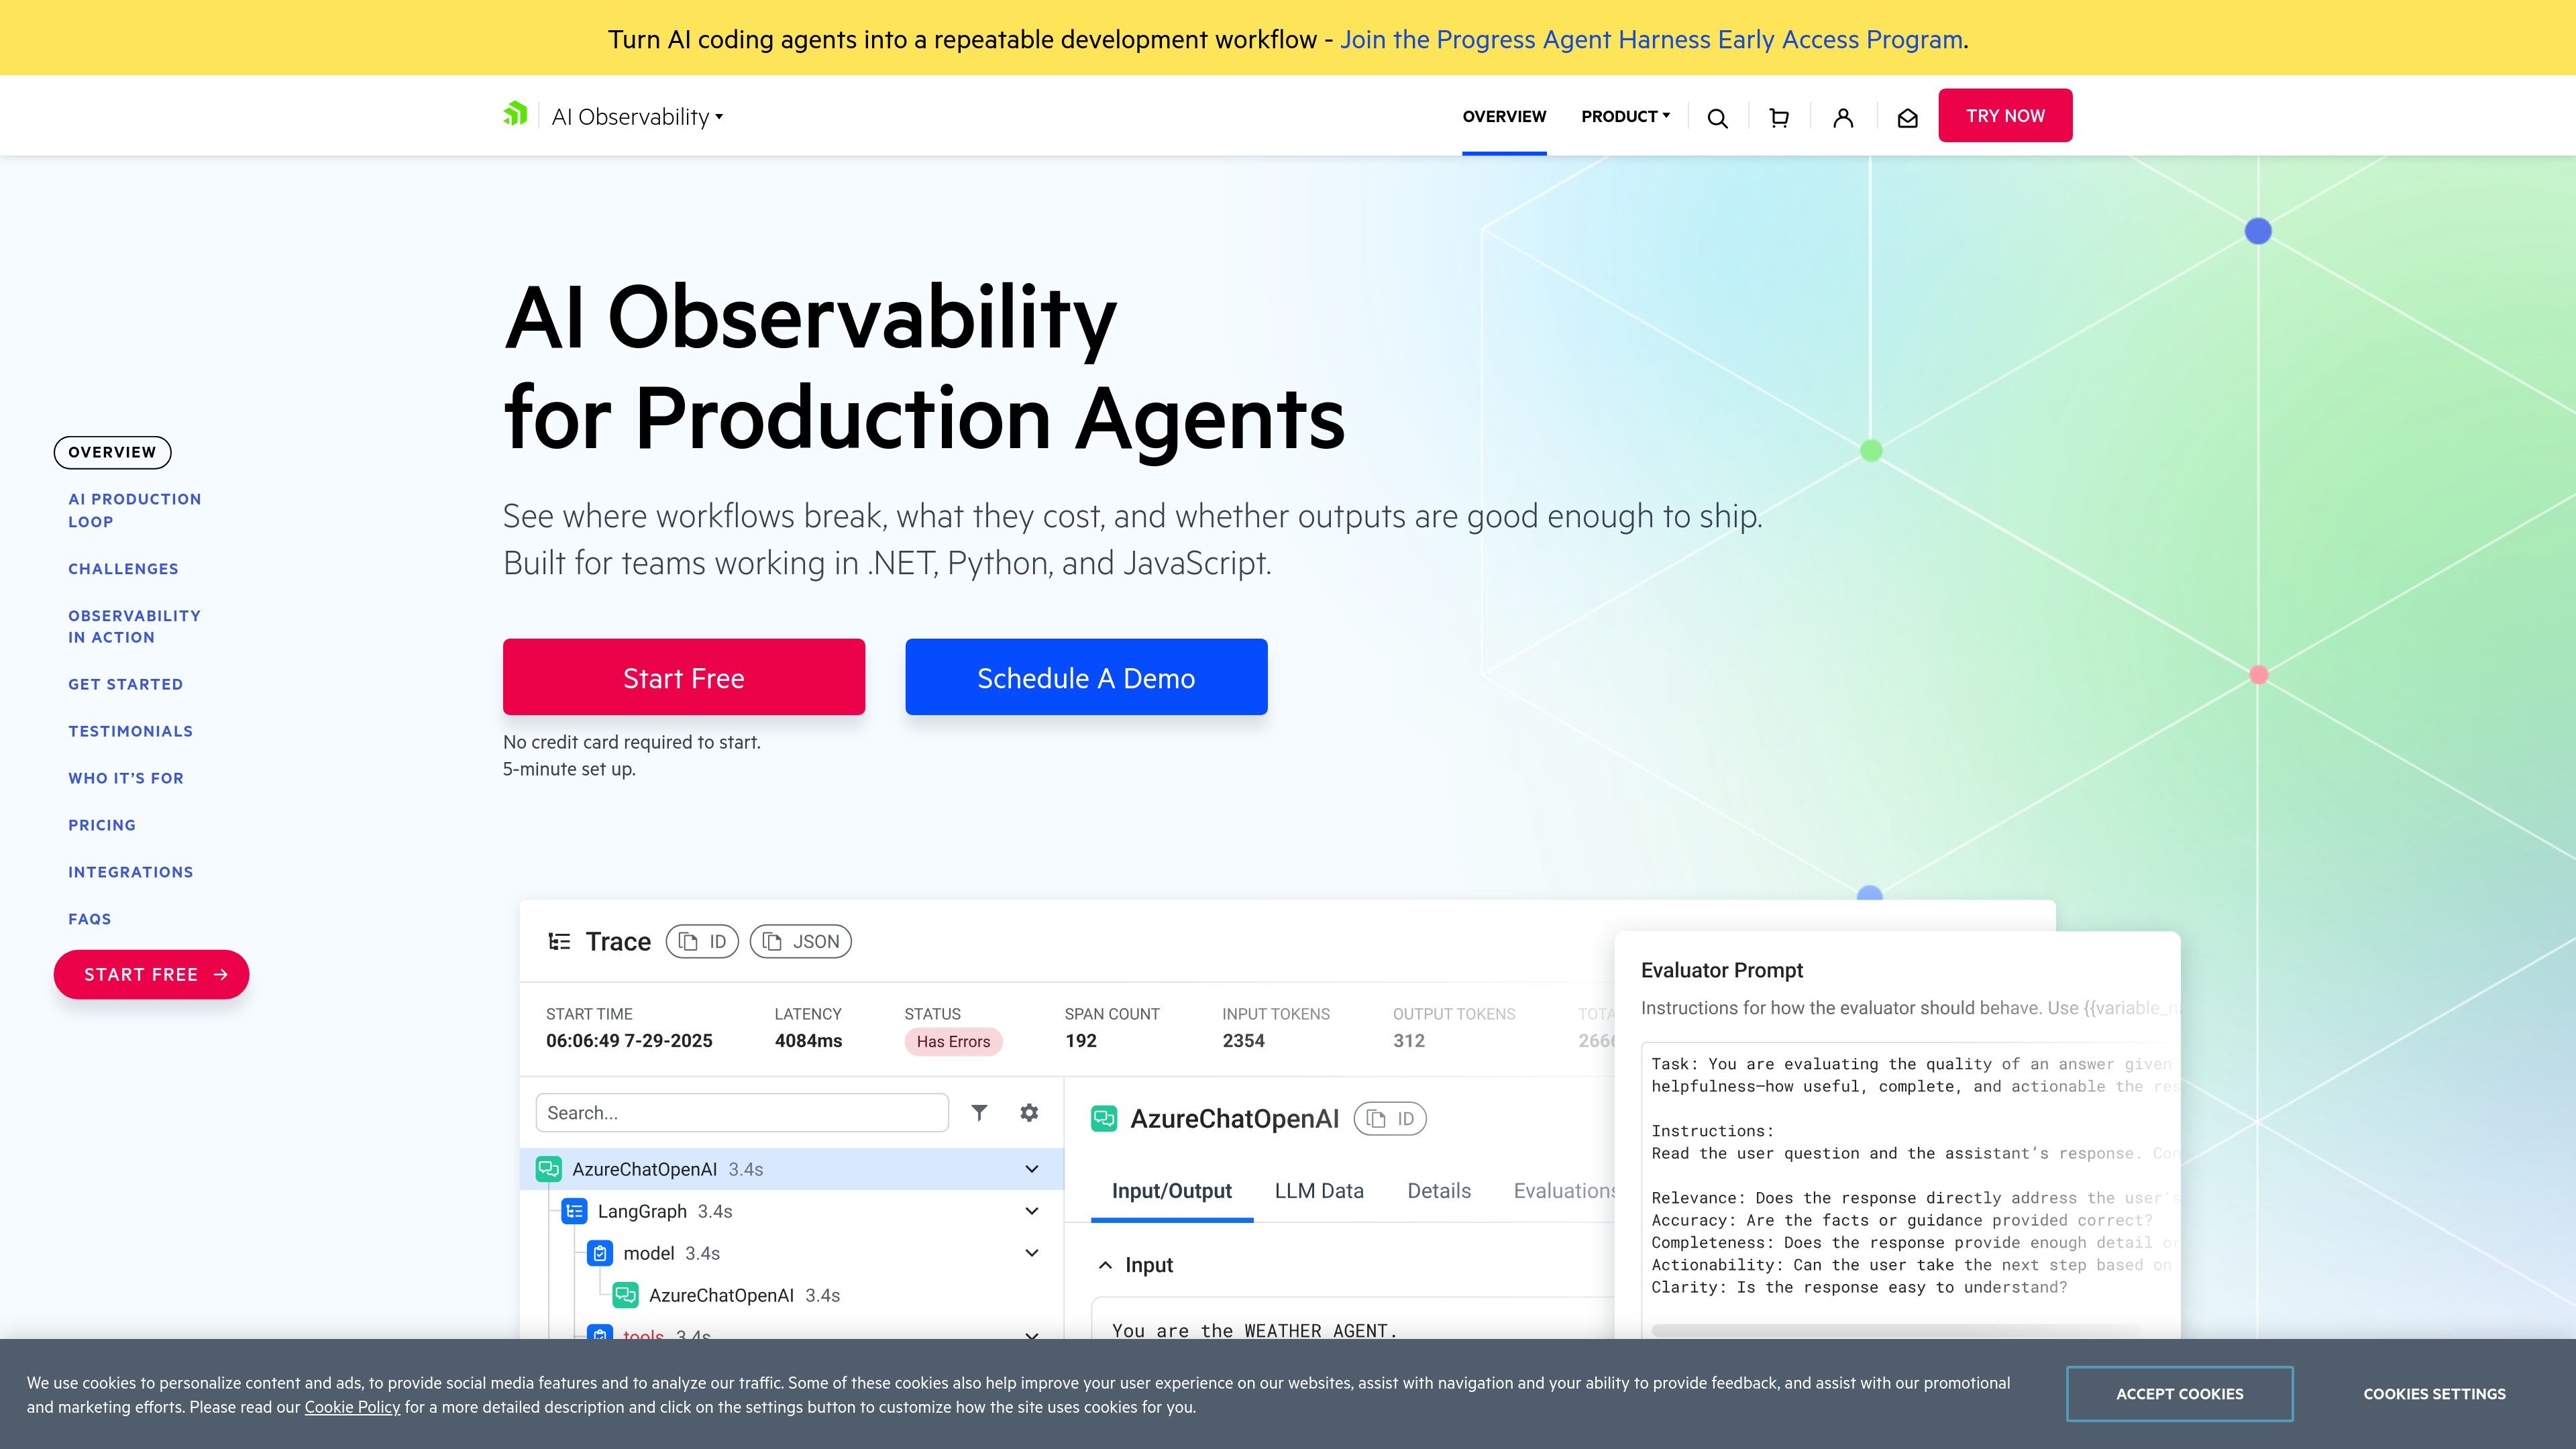
Progress Telerik’s AI Observability Platform is a developer-focused product for tracing, debugging, cost analysis, and evaluation of AI agent workflows. The site positions it around production AI systems such as agents, LLM apps, RAG systems, and copilots, where a single response may pass through prompts, retrieval, tools, retries, model calls, and custom workflow logic.
The platform is designed to give teams a full execution path and the operational context around each run: what happened, where it broke down, what it cost, and how good the output was. The homepage emphasizes live production traces, trace-level root cause analysis, cost and token visibility, and repeatable LLM evaluations tied to real execution data.
See execution paths across prompts, models, tools, retrieval steps, latency, token usage, and outputs so you can follow a multi-step AI run from start to finish.
Use trace-level context to identify skipped tools, retrieval issues, bad context, loops, retries, errors, and workflow status changes that caused a failure.
Track estimated cost and token usage across agents, workflows, models, providers, and workflow patterns to understand what drives spend.
Run LLM-as-a-judge evaluations on captured traces and compare prompt, model, or workflow changes using real execution data.
Install the SDK and instrument .NET, Python, or JavaScript apps to start capturing live traces in a dashboard.
Review supporting views such as Trace Explorer, Workflow Debugging, Cost Attribution, and Quality Scorecards to inspect the same execution data from different angles.
Inspect prompts, retrieval steps, tool calls, retries, and outputs to understand where an agent run went off course and what changed in the execution path.
Analyze multi-step or multi-agent flows when work stalls, loops, or produces incomplete results, using trace context instead of piecing together separate logs.
Review retrieved sources, prompt content, model responses, and final answers to identify why a RAG app produced a hallucination or pulled the wrong context.
Track token usage and estimated cost across models, providers, agents, and workflows to find the steps or patterns that are driving AI spend.
Score trace outputs with LLM-as-a-judge evaluations and compare prompt, model, or workflow changes side by side using real runs.
It is built for teams creating AI agents, LLM apps, RAG systems, and copilots that need trace-level visibility into how workflows run, where they fail, and what they cost. The site also highlights developer, engineering leader, and enterprise team use cases.
The product focuses on tracing AI workflows, debugging failures, tracking token usage and estimated cost, and running LLM-as-a-judge evaluations on captured traces. The site also references data export, prompt management, model optimization, performance metrics, and an AI playground as related capabilities.
The homepage says you can start free with no credit card and a 5-minute setup. It also shows SDK examples for .NET, Python, and JavaScript, with installation and instrumentation steps.
The source does not list every integration in detail, but it explicitly shows SDK support for .NET, Python, and JavaScript and says the platform includes integrations with popular AI frameworks and model providers. The pricing page also mentions enterprise features such as SSO and SCIM in other Telerik products, but those are not confirmed for this AI Observability product.
The product is positioned around production traces, live agent runs, and captured execution data. The source does not describe offline-only analysis or unsupported environments in detail.

CreateOS Sandbox is an isolated compute environment for running code and agent workloads inside Firecracker micro-VMs. It is designed for workflows that need machine-level isolation, private networking between sandboxes, and programmatic control through SDK, CLI, or MCP.

AakarDev AI helps teams manage AI provider access, project-level setups, logs, and analytics from one dashboard. It supports BYOK workflows and lists providers including OpenAI, Google Gemini, Anthropic, Groq, Mistral AI, and Perplexity AI.

Trigger.dev chat agent is a durable AI chat backend for developers building stateful conversations that can survive refreshes, crashes, and long-running turns. It connects with the AI SDK `useChat` flow and runs on managed infrastructure with no timeout on a turn.

ByteAsk is a terminal-first AI coding agent for C and C++ that edits repositories and verifies changes with the real compiler, debugger, sanitizers, and tests before showing a diff. It offers a free tier plus paid plans, with editor connectors and zero-retention handling described in the source.

PromptScout tracks how ChatGPT, Gemini, Google AI Overviews, and Perplexity mention your brand or competitors, then pairs those results with source analysis and website audits. It helps teams decide what to fix in content, positioning, or site readiness next.

Sleek Analytics is a privacy-friendly web analytics tool with real-time visitor tracking, Core Web Vitals, and revenue attribution. It helps site owners understand traffic and conversions without cookie banners or a heavy setup.