
Execution Path tracing
See every LLM call, tool use, and sub-agent delegation in an interactive trace tree with payload-level detail.

ClawTrace is observability software for OpenClaw agents. It helps teams inspect runs, trace failures, and understand where cost spikes or bottlenecks are coming from.
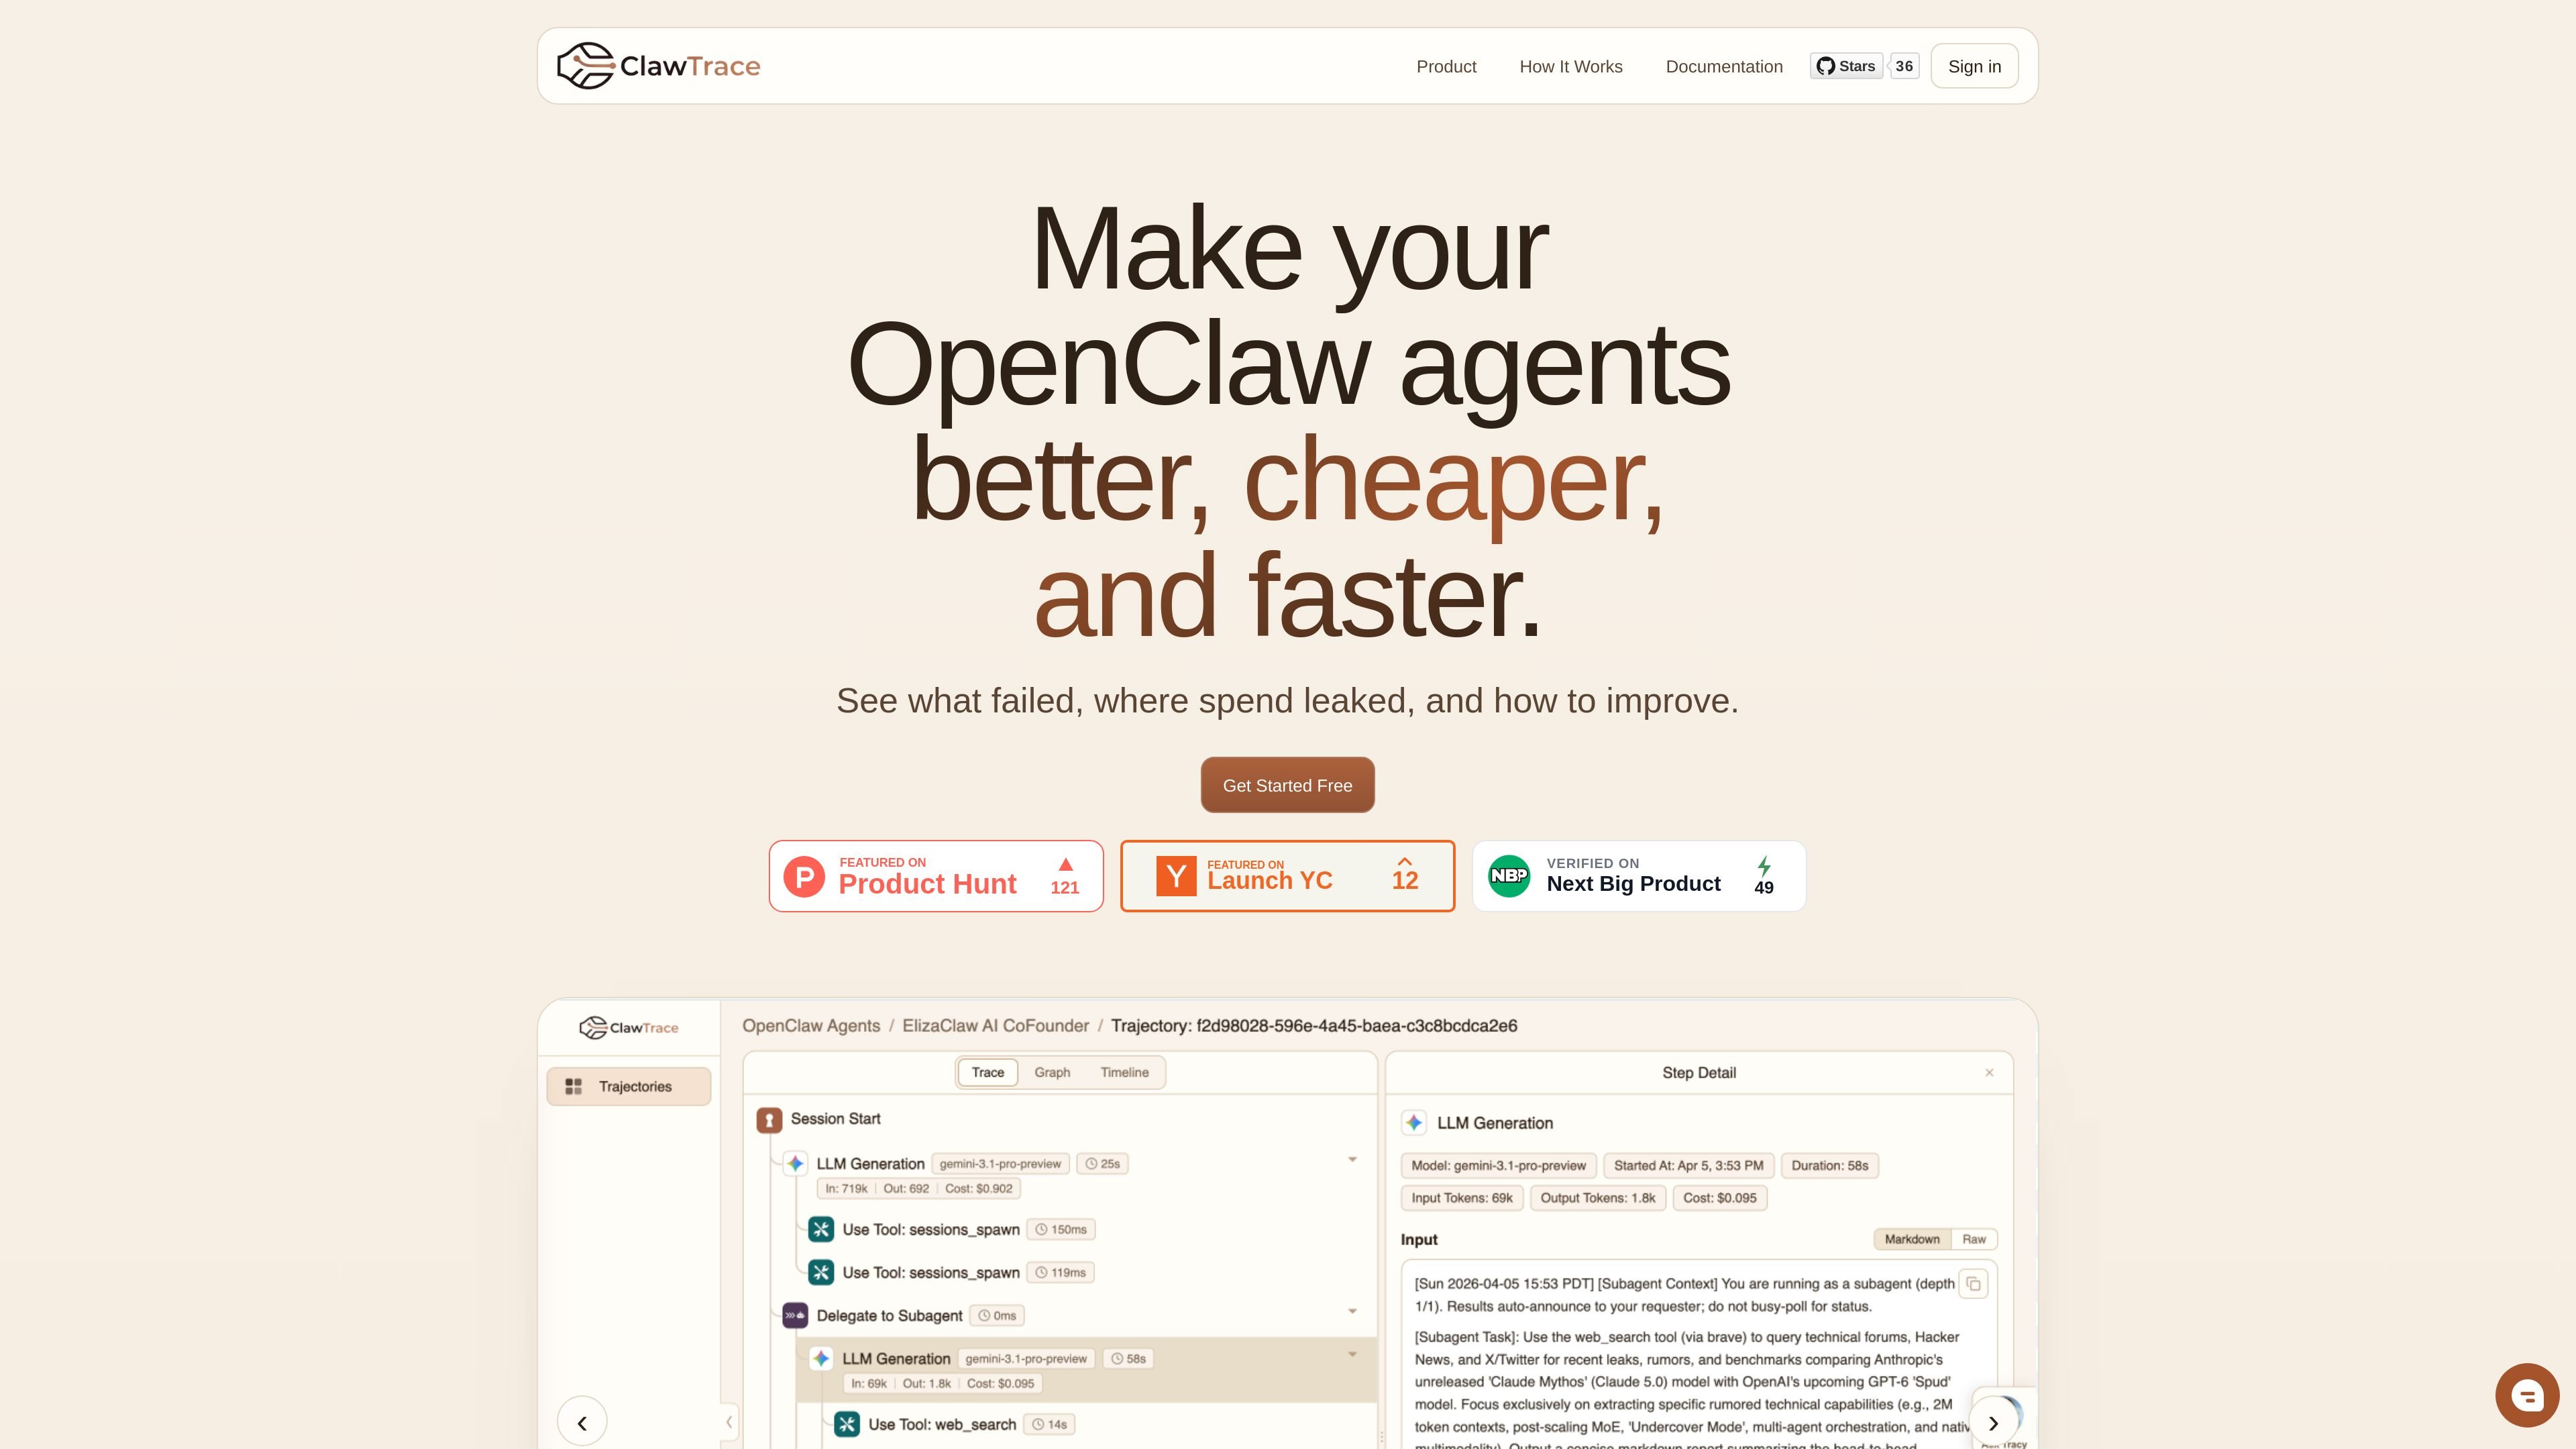
ClawTrace is observability software for OpenClaw agents. It is designed to help teams inspect runs, understand failures, and identify cost leaks so they can improve reliability without guessing.
The product combines trace inspection, trajectory-level dashboards, and an assistant named Tracy that answers questions about the current run using live data. The homepage also describes a simple setup flow: install the ClawTrace plugin, authenticate with an observe key, and restart the gateway.
See every LLM call, tool use, and sub-agent delegation in an interactive trace tree with payload-level detail.
Visualize how agents, tools, and models relate across a run with a call graph view.
Use a Gantt-style timeline to spot bottlenecks and parallel steps in a trajectory.
Review all trajectories in a dashboard with metrics, daily trends, token usage, and run-level drilldown.
Ask Tracy questions about a run and get context-aware answers that use live data from the current trajectory.
Track spend by agent run and step, plus storage and query usage, to understand where costs are going.
Inspect a failed OpenClaw run to follow the execution path, review payloads, and identify the step that likely caused the issue.
Review spend by run and step when token usage spikes, then adjust model choices or workflow steps to reduce cost.
Compare trajectories over time in the dashboard to spot regressions, bottlenecks, or unstable behavior patterns.
Ask Tracy to explain a trajectory in context when you need a quick recommendation without manually digging through every span.
Set up observability on an OpenClaw gateway by installing the plugin, authenticating, and restarting the gateway.
ClawTrace is set up by installing the ClawTrace plugin on an OpenClaw agent, authenticating with an observe key, and restarting the gateway.
The source shows ClawTrace is built for OpenClaw agents and focuses on tracing runs, surfacing failures, cost spikes, and bottlenecks.
ClawTrace provides live trace data and an assistant called Tracy that can analyze runs, explain failures, and recommend fixes.
The pricing docs describe a consumption-based billing model with credits that are spent on storage, trajectory queries, and Tracy interactions.
The source does not list supported platforms beyond OpenClaw, so broader integration support is not confirmed here.

Benchspan is an AI agent security platform that discovers agents, blocks prompt injection and data exfiltration in real time, and supports pre-launch red teaming. It is aimed at teams running agents in production and includes Python and TypeScript SDKs.

PromptScout tracks how ChatGPT, Gemini, Google AI Overviews, and Perplexity mention your brand or competitors, then pairs those results with source analysis and website audits. It helps teams decide what to fix in content, positioning, or site readiness next.

CreateOS Sandbox is an isolated compute environment for running code and agent workloads inside Firecracker micro-VMs. It is designed for workflows that need machine-level isolation, private networking between sandboxes, and programmatic control through SDK, CLI, or MCP.

Sleek Analytics is a privacy-friendly web analytics tool with real-time visitor tracking, Core Web Vitals, and revenue attribution. It helps site owners understand traffic and conversions without cookie banners or a heavy setup.

Codex Plugins bundle reusable skills, app integrations, and MCP servers into workflows you can install in the Codex app or use from Codex CLI. They help extend Codex with connected-service tasks, reusable instructions, and shared team workflows.

MacSpoof — смена MAC-адреса в macOS: меняйте или рандомизируйте Wi‑Fi MAC, чтобы переподключаться и меньше светить идентификатор в публичных сетях.