
One-step bug capture
Capture a bug in one browser shortcut or a quick export flow. TraceBug records the session automatically so the report includes what happened without a manual write-up.

TraceBug is a browser-based bug reporting tool that captures a failing session and exports it as a self-contained HTML report. It helps developers, testers, and AI coding agents inspect replay, console errors, network activity, and screenshots without requiring an account or upload.
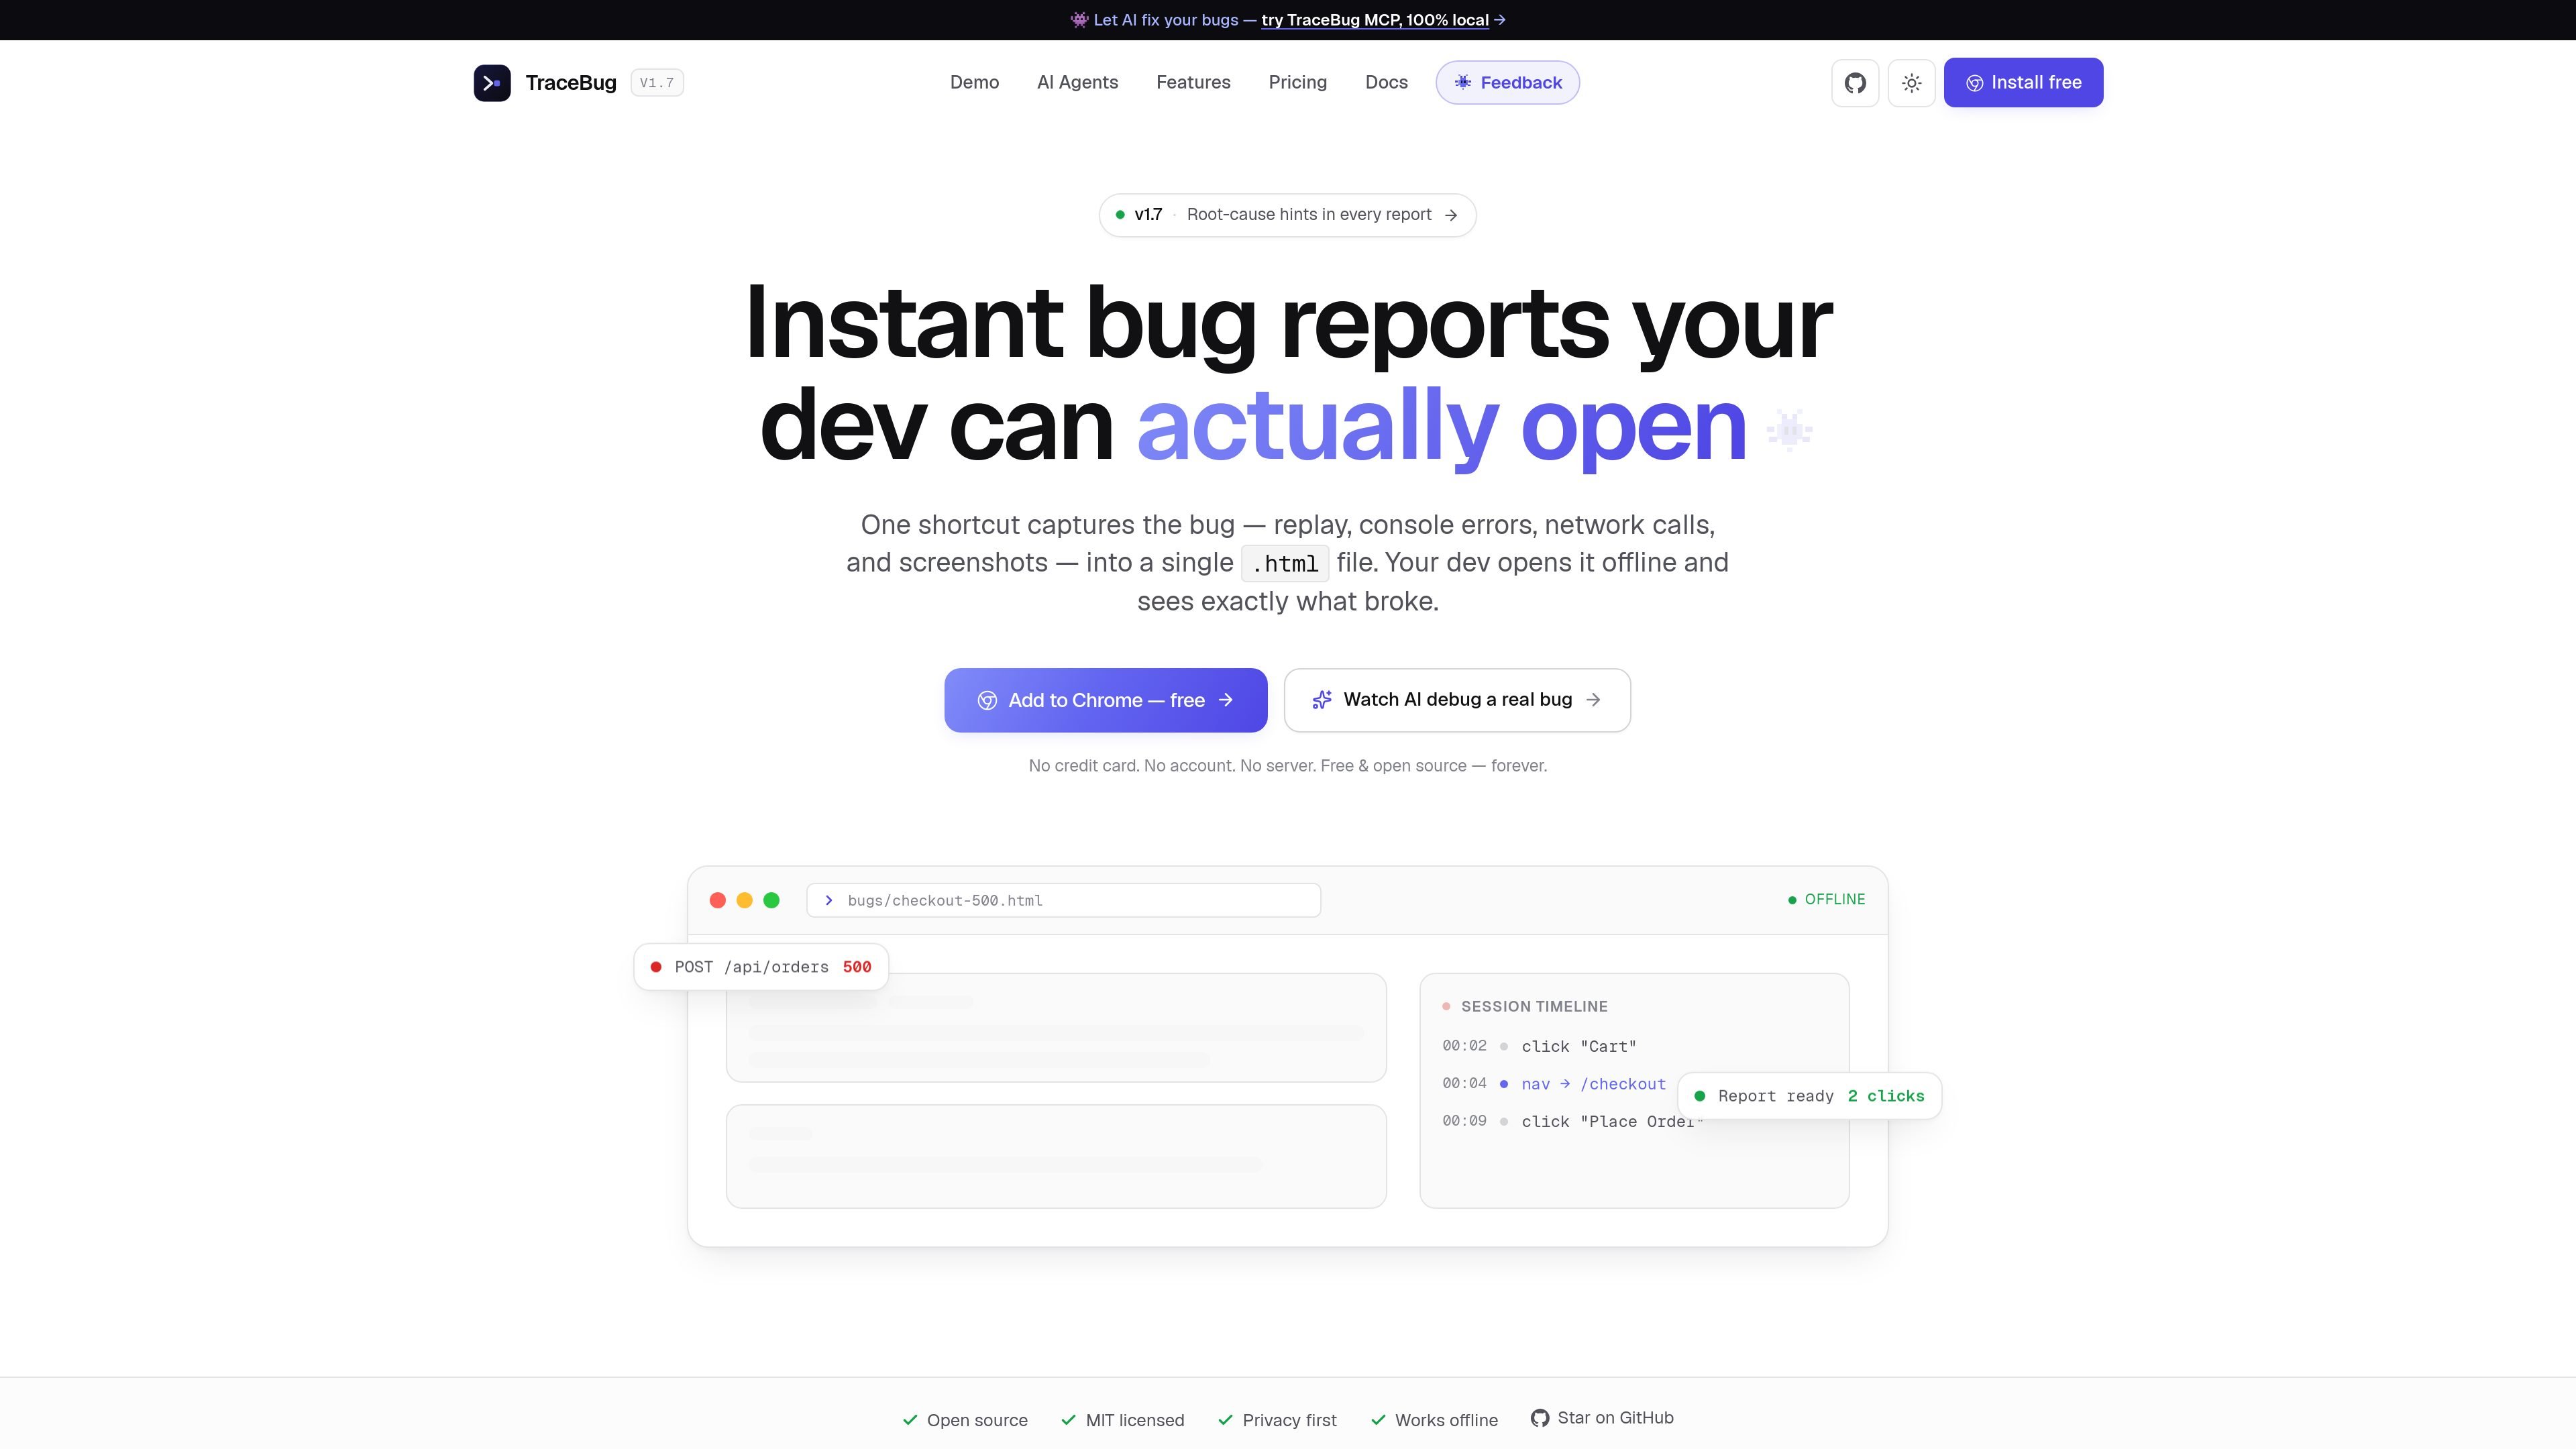
TraceBug is a browser-based bug reporting tool that captures a failing session and packages it into a single HTML file a developer can open locally. The export includes replay, console errors, network requests, screenshots, and a root-cause hint so the report carries more than a static screenshot or a vague ticket description.
The product is built around a local-first workflow: anyone can capture and export a report without creating an account, uploading data, or setting up a backend. For hand-off, the exported file can be shared directly or read by an AI coding agent through TraceBug’s local MCP server, which is designed to work with tools such as Claude Code, Cursor, Windsurf, and VS Code.
Capture a bug in one browser shortcut or a quick export flow. TraceBug records the session automatically so the report includes what happened without a manual write-up.
Bundle the full session into a single .html file that can be opened offline. The exported report is self-contained, so it can be sent as a file instead of requiring a login or hosted link.
Include the evidence a developer usually needs to reproduce a failure: replay, console errors, network calls, screenshots, and a timeline of user actions.
Surface a root-cause hint at the top of the report. The site shows the suspected failing request or exception before the rest of the session details, helping a developer start in the right place.
Export reports to GitHub, Linear, Slack, and PDF, with Chrome extension and npm SDK options listed on the pricing page. The docs also describe a local MCP server for AI agents.
Support local and team workflows with options for cloud sharing, workspace roles, activity feeds, quotas, analytics, Google SSO, and self-hosting in higher tiers.
A tester or support person hits a bug in a browser app and needs to preserve the exact sequence of clicks, requests, and errors without filling out a long form.
A developer receives a file from Slack, email, or a ticket attachment and wants to inspect the console trace, network failures, and timeline offline before opening the codebase.
A team wants to hand bug reports to Claude Code, Cursor, or another MCP client so an AI agent can read the export and investigate the likely root cause.
A small team wants shared workspaces, auto-sync to issue trackers, and role-based collaboration instead of only local files.
An organization needs self-hosting, SSO, audit logs, and custom retention controls for a more governed deployment.
TraceBug is designed to capture a bug as a self-contained HTML file with session replay, console errors, network requests, screenshots, and a root-cause hint. The report can be opened offline by a developer or handed to an AI coding agent through the MCP server.
The home page says the core capture flow is free, with no account and no server required. The pricing page adds that local bug capture and offline HTML exports are free forever, while collaboration features are paid when teams want cloud sharing, integrations, or self-hosting.
The docs describe a local Model Context Protocol server that reads exported HTML reports from disk and works with Claude Code, Cursor, Windsurf, VS Code, and any MCP client.
The source does not describe a mobile app or desktop app. The published workflow is browser-based: capture in the browser, export an HTML file, then share or open it locally.
The pricing page shows three paid tiers in addition to the free local capture workflow: Pro for individual cloud sharing, Team for shared workspaces and auto-sync, and Enterprise for self-hosted deployment and compliance-oriented controls. Several paid features are marked as coming soon.

ByteAsk is a terminal-first AI coding agent for C and C++ that edits repositories and verifies changes with the real compiler, debugger, sanitizers, and tests before showing a diff. It offers a free tier plus paid plans, with editor connectors and zero-retention handling described in the source.

Manta AI is an autonomous web app testing tool for teams that want to map application behavior, catch regressions, and generate tests without writing scripts or maintaining selectors. It works from a URL and supports plain-English test flows, run results with screenshots, and scheduled or deployment-triggered checks.

PromptScout tracks how ChatGPT, Gemini, Google AI Overviews, and Perplexity mention your brand or competitors, then pairs those results with source analysis and website audits. It helps teams decide what to fix in content, positioning, or site readiness next.

Sleek Analytics is a privacy-friendly web analytics tool with real-time visitor tracking, Core Web Vitals, and revenue attribution. It helps site owners understand traffic and conversions without cookie banners or a heavy setup.

hob is an independent workspace for coding agents that keeps agent sessions, terminals, history, and follow-up work organized around the tools and providers you already use. It is aimed at developers who want local control over routing, history, and workspace structure rather than a bundled model stack.

Ably Chat is a chat API platform for building custom realtime chat applications. It supports room-based messaging, typing indicators, presence, reactions, and message updates, with usage-based pricing options for different deployment stages.