
Core traffic metrics
Shows visitors, pageviews, views per visit, bounce rate, and average time, with sparklines and previous-period comparisons for each metric.

Edgemetry is a self-hosted web analytics tool for Cloudflare that tracks site traffic with a privacy-first design. It focuses on lightweight deployment, no cookies, and dashboard reporting without third-party browser requests.
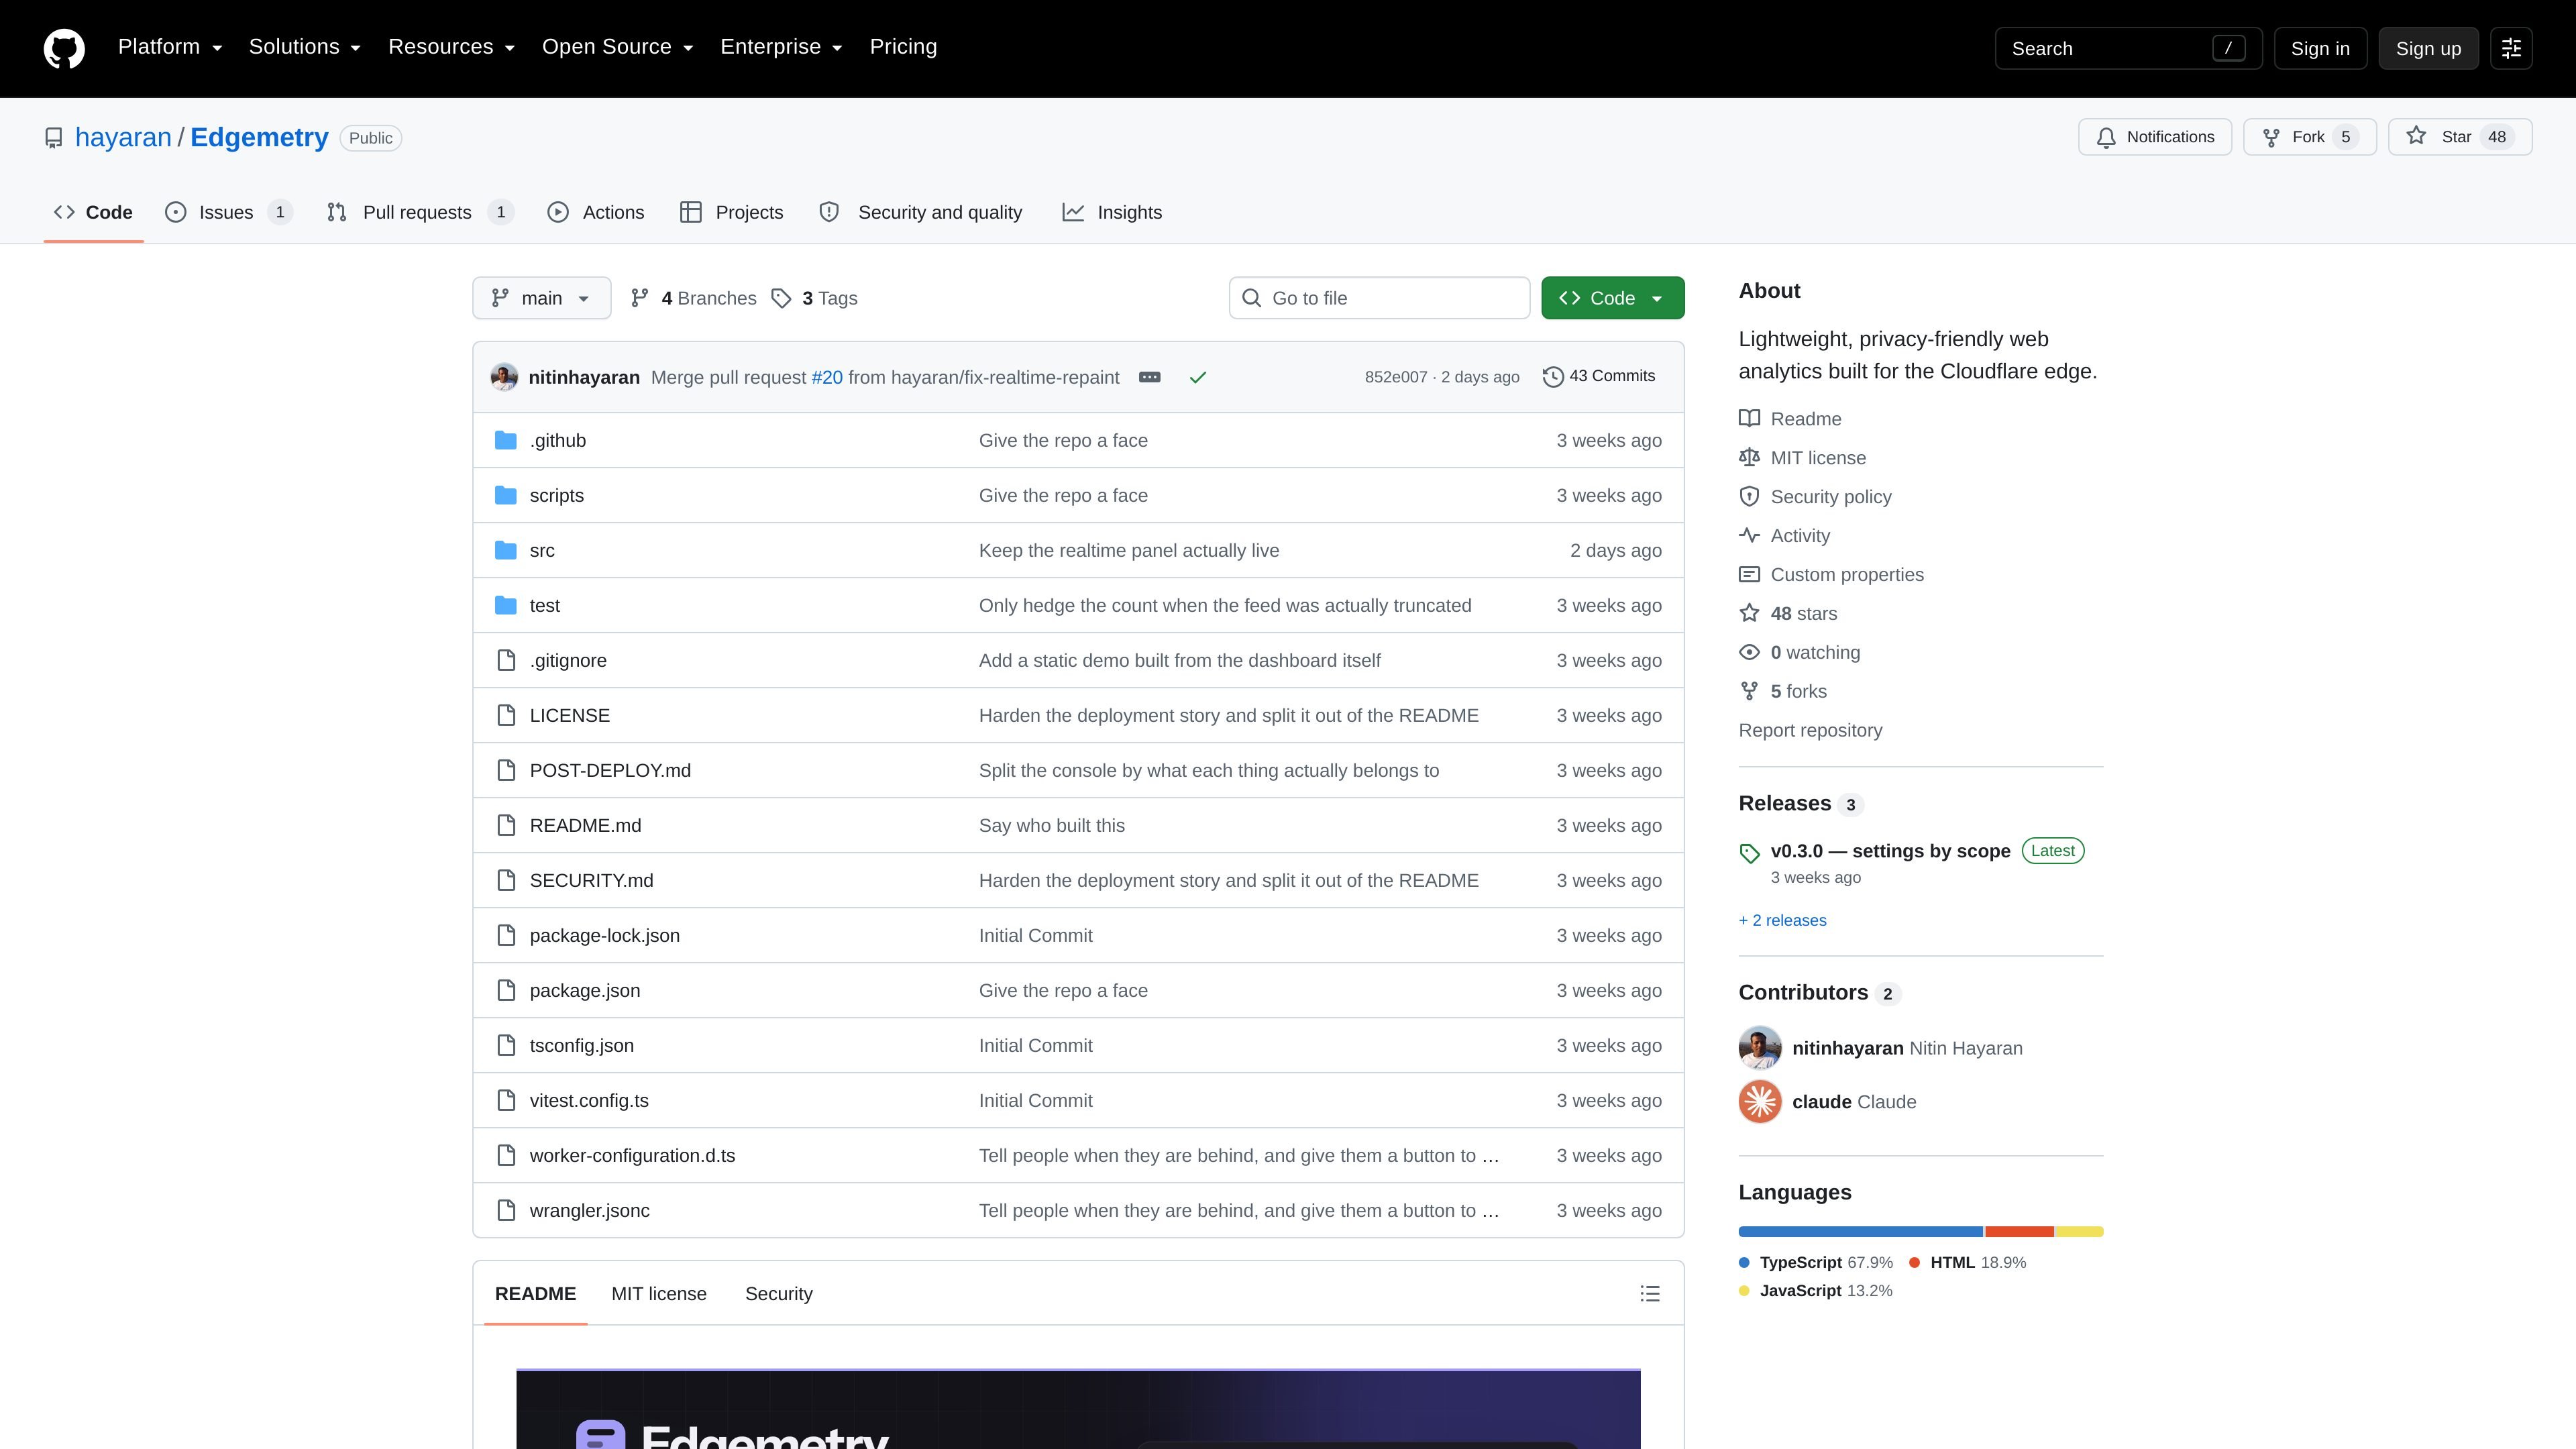
Edgemetry is a privacy-first web analytics tool you run yourself on Cloudflare’s edge. It uses one Worker and one D1 database, and the README says it avoids cookies, consent banners, and personal data stored at rest.
It is aimed at people who want simple self-hosted analytics without running Docker or paying for a separate hosted analytics service. The project provides a demo dashboard, a deployment flow that creates the database automatically, and a tracking snippet for adding sites after the instance is claimed.
Shows visitors, pageviews, views per visit, bounce rate, and average time, with sparklines and previous-period comparisons for each metric.
Lets you click any row to narrow every panel at once, so you can filter by combinations such as page, referrer, country, device, or campaign tags.
Breaks traffic down by page, entry page, exit page, referrer, country, browser, operating system, device, screen size, and UTM tags.
Includes realtime views: a live counter, the last 30 minutes minute by minute, and a feed of pages being read right now.
Supports custom events with a one-line edgemetry('signup') call, plus a command palette that searches every dimension and returns filters.
Supports multiple sites and multiple users on one deployment, with owner and viewer roles and per-site access control enforced server-side.
A solo site owner can deploy Edgemetry on Cloudflare, claim the instance, add a custom domain, and copy the snippet into the site head to start collecting traffic without a hosted analytics subscription.
A small team can share one deployment across several sites, then give different users viewer access to only the properties they need to see.
A publisher or creator can watch live pageviews, recent minutes, and current readers to see whether a post is getting traffic right now.
A marketer can break traffic down by country, device, browser, and UTM tags to inspect campaign and audience segments from one dashboard.
A developer can use custom events and the command palette to find and filter specific actions or dimensions without leaving the dashboard.
Edgemetry is deployed as a Cloudflare Worker with a D1 database. The README says Cloudflare creates the database automatically during deploy, and the dashboard provides a tracking snippet after you claim the instance.
The README says you can run multiple sites and multiple users on one deployment, with per-site access controls. Owners can manage sites and users, while viewers get read-only access only to the sites they are granted.
The dashboard reports five core metrics: visitors, pageviews, views per visit, bounce rate, and average time. It also includes breakdowns, realtime views, custom events, and a command palette for filtering.
The project is built to avoid cookies, fingerprinting, personal data at rest, and third-party browser requests. The README also says the tracking script is about 2.1 KB and is served from your own domain.
The README says the project is designed around Cloudflare's free tier and D1 limits. It also notes that only total traffic counts against the free tier, while site count itself does not.

PromptScout tracks how ChatGPT, Gemini, Google AI Overviews, and Perplexity mention your brand or competitors, then pairs those results with source analysis and website audits. It helps teams decide what to fix in content, positioning, or site readiness next.

Sleek Analytics is a privacy-friendly web analytics tool with real-time visitor tracking, Core Web Vitals, and revenue attribution. It helps site owners understand traffic and conversions without cookie banners or a heavy setup.

Rectify is an all-in-one SaaS operations platform that combines session replay, monitoring, support, code scanning, roadmaps, and changelogs. It is aimed at founders and product teams, especially non-technical SaaS teams working with AI-assisted development.

SaveMRR is a Stripe retention tool for SaaS teams that scans billing data for churn and MRR leaks, then automates recovery through dunning, cancel-save offers, win-back emails, and onboarding nudges. It is built for founders and bootstrapped teams using Stripe.

Hype is a web tool for finding trending YouTube topics by category, time range, and scoring mode. It helps creators spot emerging ideas, inspect source videos, and decide what to cover next.

Struere is an AI-native platform for turning spreadsheet data into structured operational software with dashboards, alerts, and automations. It is aimed at teams that want to replace manual spreadsheet workflows without building custom tools from scratch.