
Two-terminal debugging workflow
Runs an AI assistant in the terminal while a second command starts your application under debugging. This keeps the debugging conversation close to the live process.

OpenBug CLI is a command-line debugging tool that uses AI to analyze live application logs and search local code while you run commands. It is built for developers who want terminal-based, real-time debugging across one or more services.
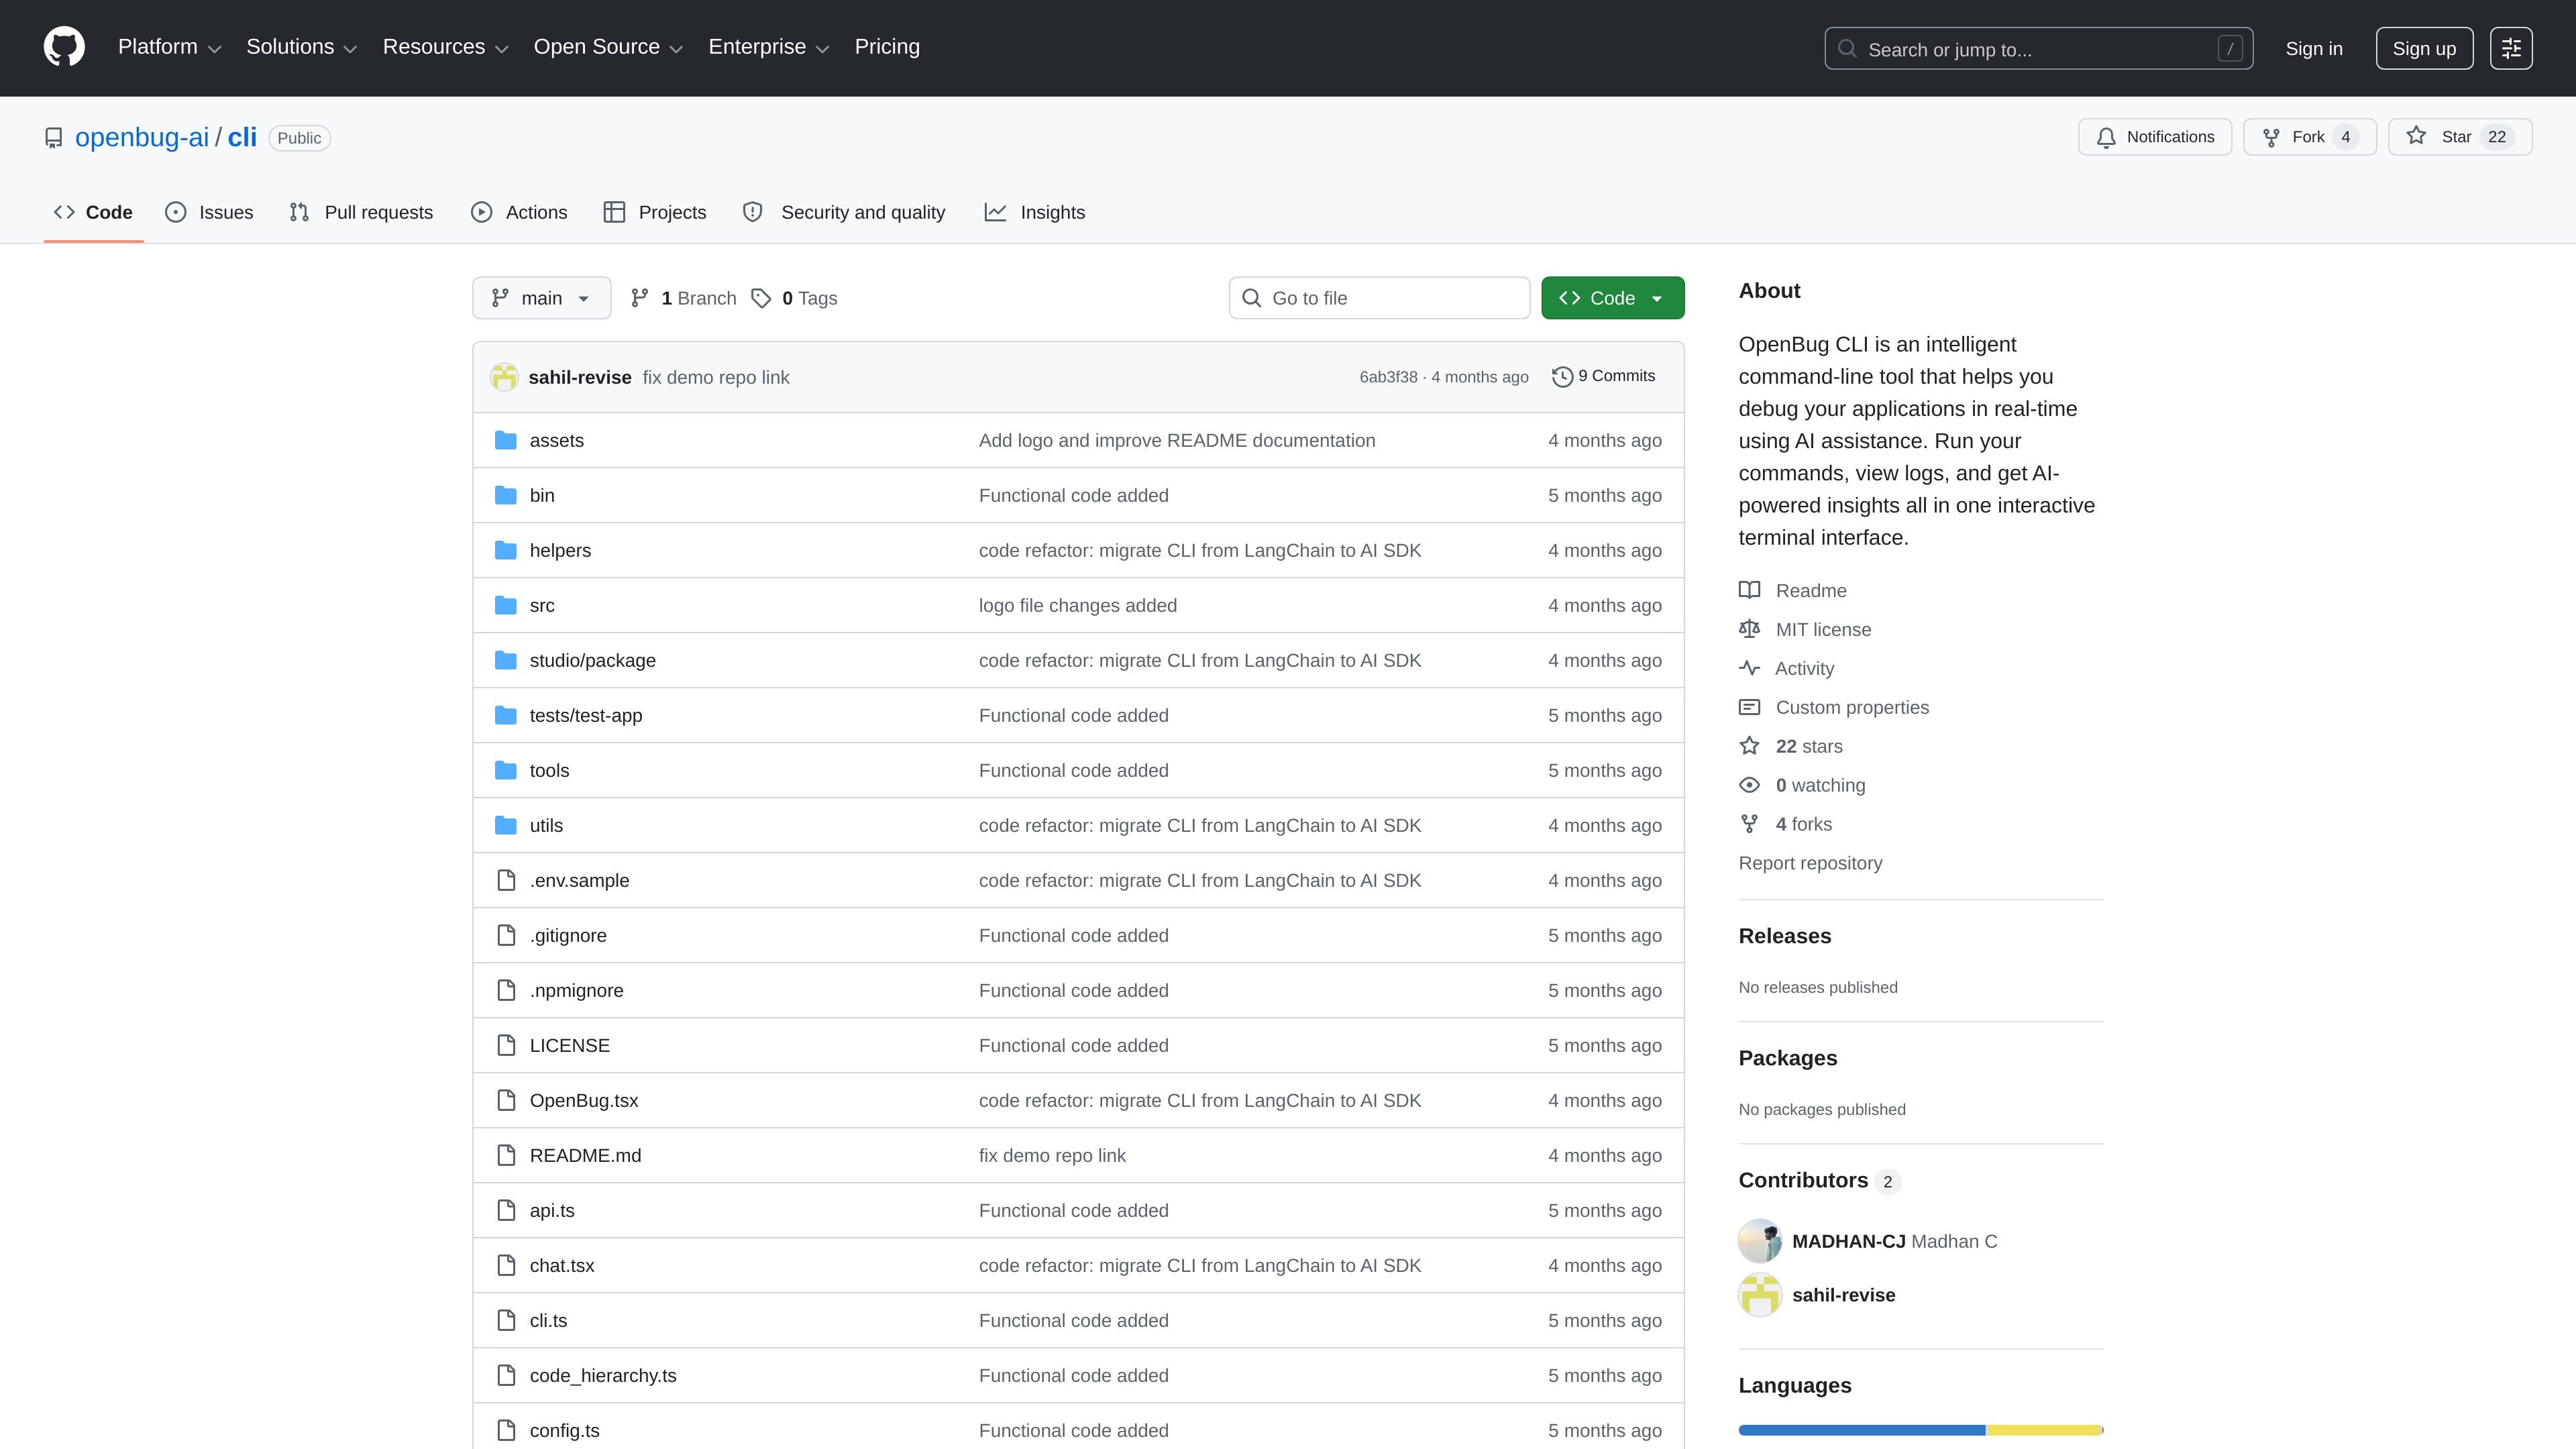
OpenBug CLI is a command-line tool for debugging running applications with AI assistance. It combines a terminal assistant, live log capture, and local codebase search so you can investigate issues while the app is actually executing.
The workflow is centered on `debug`: one terminal starts the assistant, and another runs your app or service through `debug <command>`. The README says this can help with single services or multiple services connected to the same local cluster, while keeping code access local and streaming logs only when needed for analysis.
Runs an AI assistant in the terminal while a second command starts your application under debugging. This keeps the debugging conversation close to the live process.
Automatically captures logs from the running service and makes them available to the assistant so answers are based on runtime behavior instead of static analysis alone.
Searches the local codebase in natural language, allowing questions such as where a webhook or token validation path is handled without manual grep.
Connects multiple running services to the same local cluster, which lets the assistant correlate logs and code across a larger stack.
Provides a browser-based `studio` mode and a terminal UI with shortcuts for switching views, reconnecting, and managing the chat/log display.
Supports first-time project setup that creates `openbug.yaml` and registers the service with the local cluster automatically.
Run a service with `debug <command>` while the assistant watches logs and answers questions about what the application is doing at runtime.
Connect backend and frontend services to the same cluster so the assistant can trace failures across logs from multiple terminals.
Ask natural-language questions about unfamiliar code, such as where a feature or validation path is implemented, and let the assistant search locally.
Use the browser `studio` view when you want a different debugging interface than the terminal and need to inspect chat or logs visually.
Set up a new project with the first-run prompts and generated `openbug.yaml` so the same configuration is reused on later runs.
OpenBug CLI starts an AI assistant in one terminal and runs your application command in another. On first use in a directory, it prompts for a project description and creates an `openbug.yaml` configuration file.
The README says OpenBug can capture logs automatically, search your codebase in natural language, and chat with an AI that understands the running system. It is designed for debugging live applications rather than static code review.
The CLI supports workflows where multiple services are running in separate terminals and connect to the same local cluster, so the AI can inspect logs across services and search code in more than one repository.
The README states that your code stays local and is accessed locally, while only specific snippets queried by the AI are sent to the server. Logs are streamed only when needed to answer a question.
OpenBug CLI is in beta and actively developed. The source also lists Node.js 20+ and a compatible package manager as requirements, so users should expect an evolving tool with a defined runtime setup.

AakarDev AI helps teams manage AI provider access, project-level setups, logs, and analytics from one dashboard. It supports BYOK workflows and lists providers including OpenAI, Google Gemini, Anthropic, Groq, Mistral AI, and Perplexity AI.

ByteAsk is a terminal-first AI coding agent for C and C++ that edits repositories and verifies changes with the real compiler, debugger, sanitizers, and tests before showing a diff. It offers a free tier plus paid plans, with editor connectors and zero-retention handling described in the source.

PromptScout tracks how ChatGPT, Gemini, Google AI Overviews, and Perplexity mention your brand or competitors, then pairs those results with source analysis and website audits. It helps teams decide what to fix in content, positioning, or site readiness next.

CreateOS Sandbox is an isolated compute environment for running code and agent workloads inside Firecracker micro-VMs. It is designed for workflows that need machine-level isolation, private networking between sandboxes, and programmatic control through SDK, CLI, or MCP.

Sleek Analytics is a privacy-friendly web analytics tool with real-time visitor tracking, Core Web Vitals, and revenue attribution. It helps site owners understand traffic and conversions without cookie banners or a heavy setup.

hob is an independent workspace for coding agents that keeps agent sessions, terminals, history, and follow-up work organized around the tools and providers you already use. It is aimed at developers who want local control over routing, history, and workspace structure rather than a bundled model stack.