
Document intelligence
Upload documents or spreadsheets and let OrangeLabs extract, categorize, and organize the data automatically.

OrangeLabs is an AI data visualization platform that helps non-technical users query raw data, build interactive visuals, and turn insights into presentation-ready outputs. It also lists common business connectors and a 7-day free trial on the Starter plan.
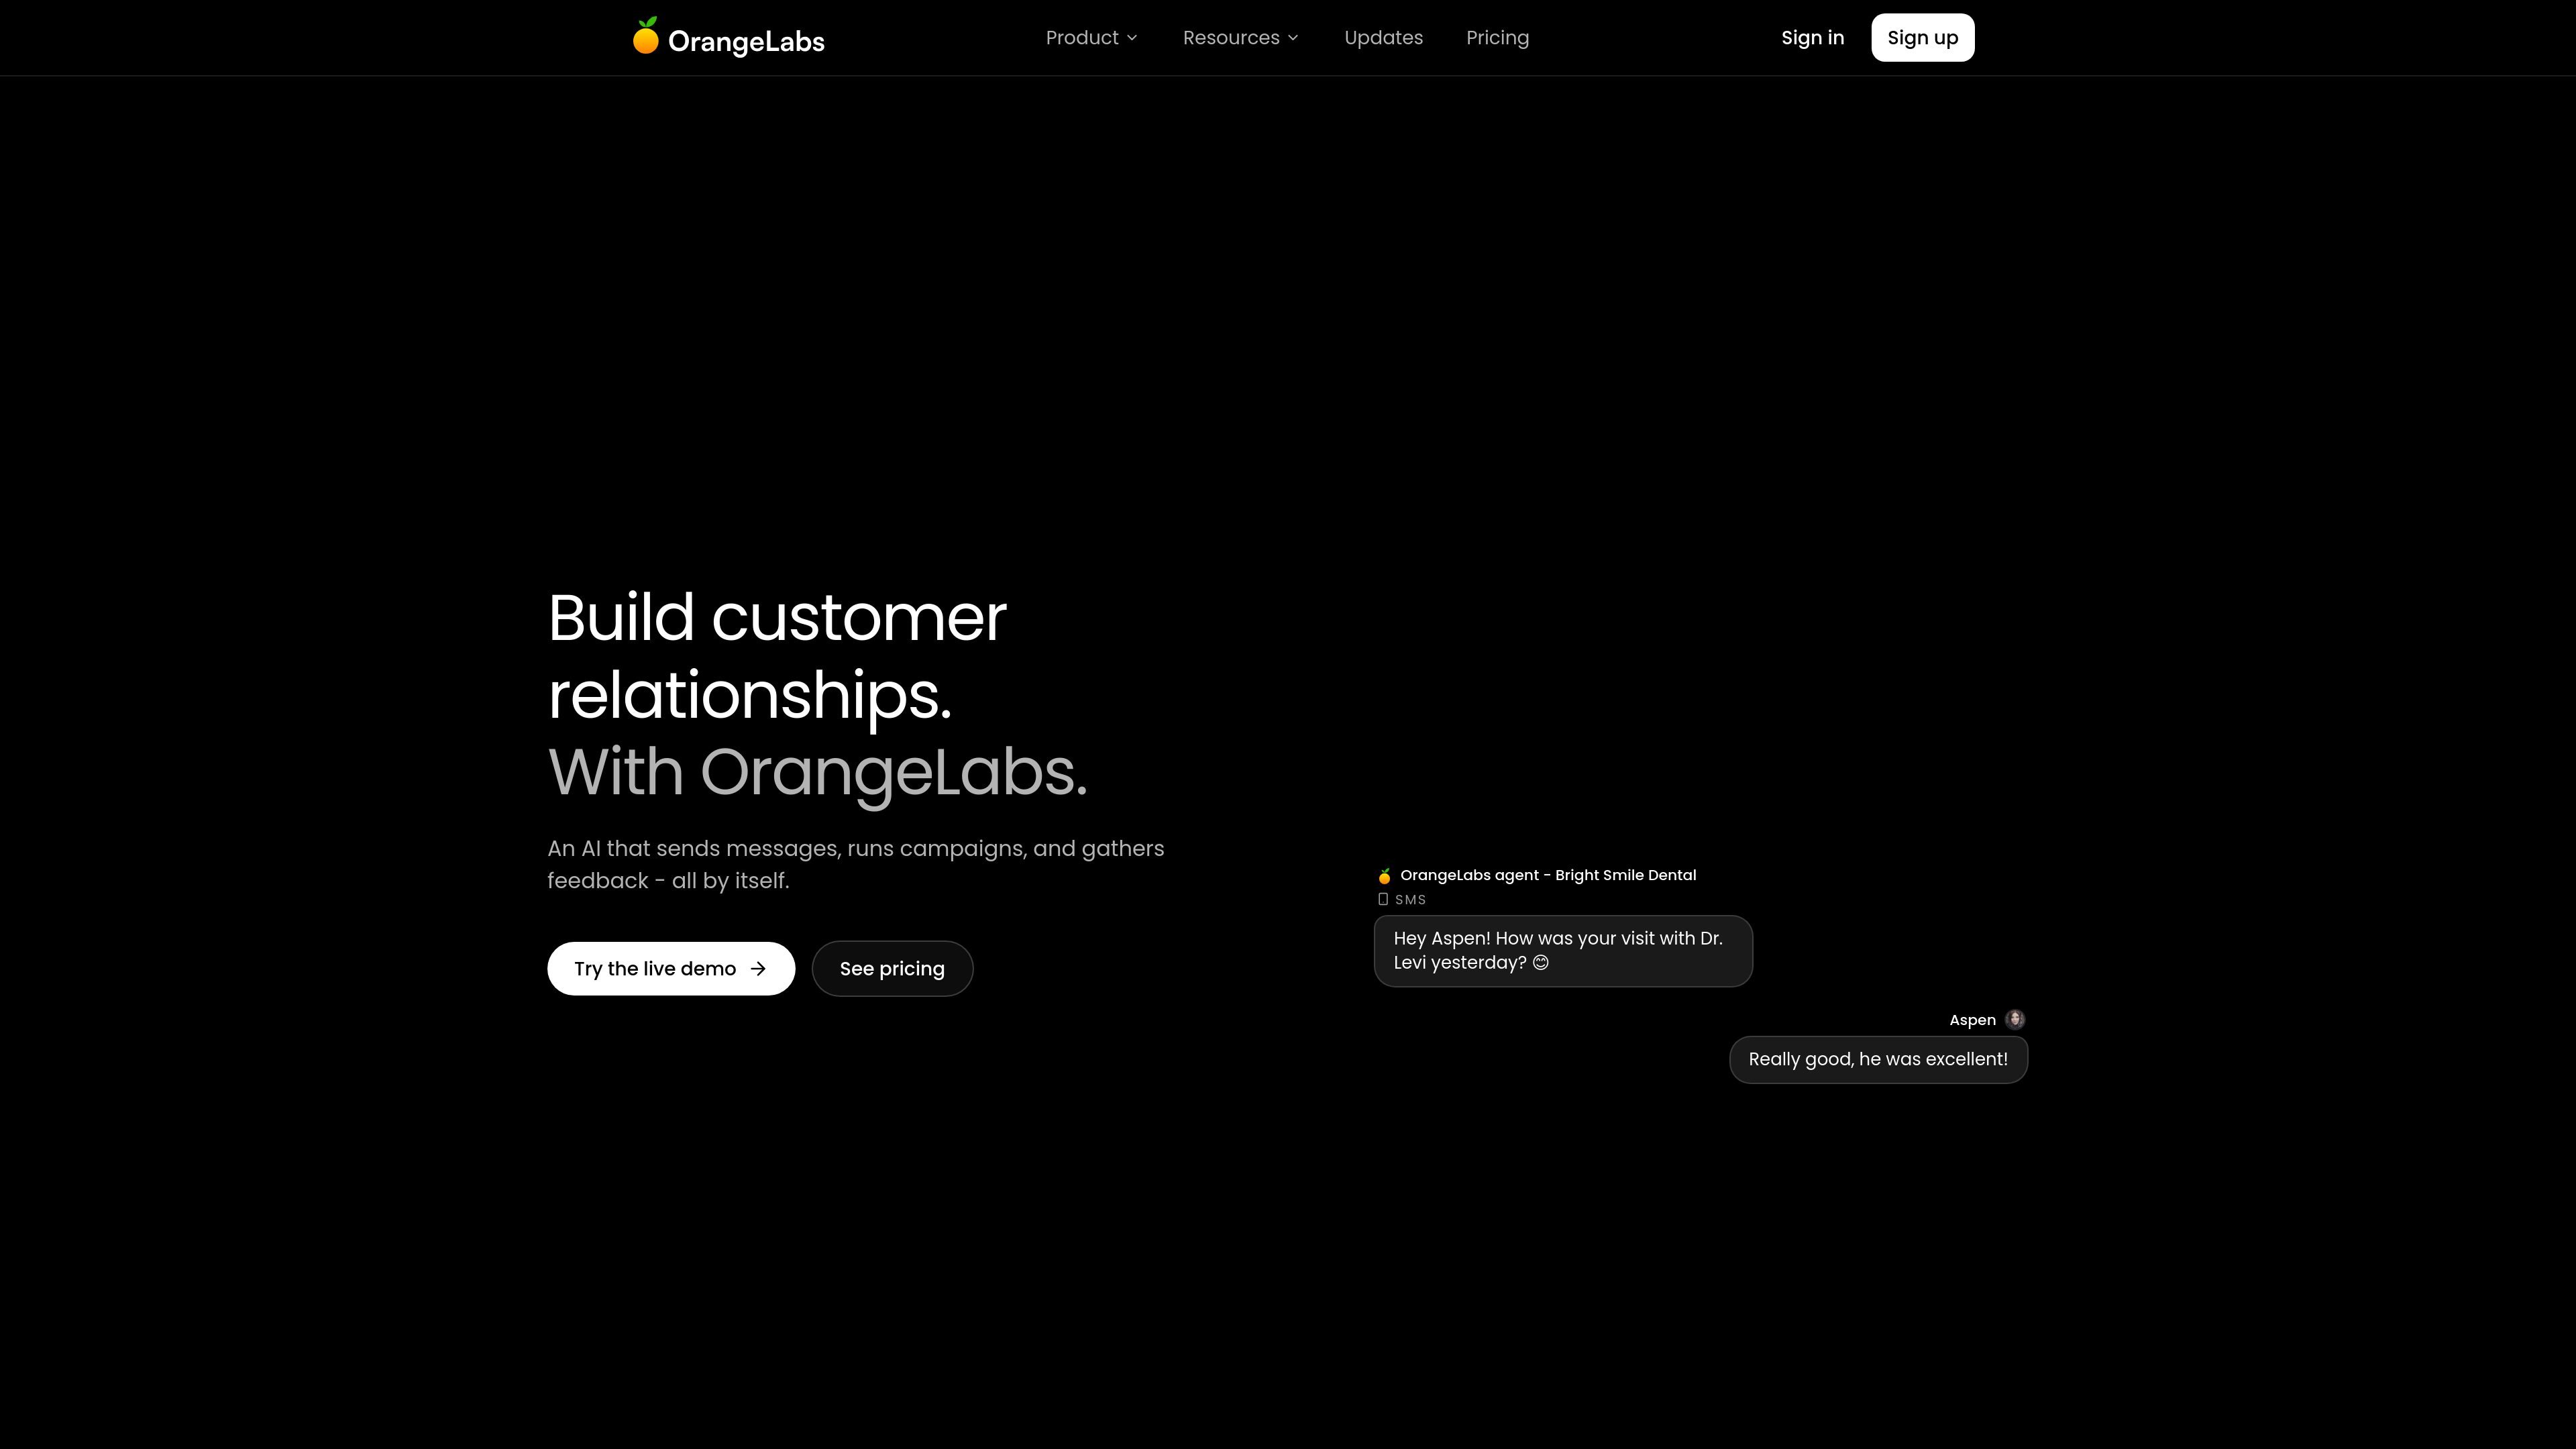
OrangeLabs is an AI data visualization platform for querying raw data and turning it into interactive visuals. The site positions it for non-technical users who want to work with data in plain English instead of SQL, Python, or spreadsheet formulas.
The product supports document and spreadsheet analysis, visual generation, and slide creation from insights. Its interface also highlights a library of 40+ visual prompts and templates and a set of common business connectors, suggesting a workflow that starts with connected data and ends with shareable outputs.
Upload documents or spreadsheets and let OrangeLabs extract, categorize, and organize the data automatically.
Ask questions in plain English instead of writing SQL, Python, or Excel formulas to inspect raw data.
Turn data into editable charts and visuals such as pie charts, sunburst graphs, and bar graphs.
Convert insights and charts into presentation-ready slide decks from the same workflow.
Use the built-in prompt gallery with 40+ visual prompts and templates to speed up common analysis tasks.
Connect to common business data sources including Sheets, Excel, CSV, PDF, Notion, Slack, HubSpot, Salesforce, Airtable, Postgres, Stripe, and Gmail.
Finance teams can automate reporting, track expenses, and build dashboards without code, based on the use-case page example.
Business users can upload documents or spreadsheets, extract key fields, and turn the results into structured analysis.
Teams can convert raw insights into charts or slide decks for reviews, updates, or presentations.
Operations or customer-facing teams can connect tools such as Sheets, Slack, HubSpot, Salesforce, and Gmail to analyze data across everyday systems.
OrangeLabs is designed for teams that want to query data and generate visuals without writing SQL, Python, or Excel formulas. The source also highlights use for AI-driven messaging and campaign workflows, but the product pages shown focus on data analysis and visualization.
The source shows a 7-day free trial on the Starter plan. Pricing pages also list an Enterprise plan and mention that advanced features are coming soon.
OrangeLabs supports uploading documents, spreadsheets, and other data sources shown in the interface, then using plain-English prompts to analyze data and build interactive visuals. The product pages also mention creating slides and data UI outputs.
The site presents connectors for Google Sheets, Excel, CSV, PDF, Notion, Slack, HubSpot, Salesforce, Airtable, Postgres, Stripe, and Gmail, plus a browse-all-connectors option.
The visual guide page says a full walkthrough of every OrangeLabs feature is coming soon, so some parts of the product are still being documented publicly.

Napkin AI trasforma il testo in elementi visivi modificabili per presentazioni, documenti e contenuti condivisibili. Generazione da testo, collaborazione ed export in PPT, PNG, SVG o PDF.

Bricks is an AI data analyst that turns CSV, Excel, PDF, PNG, Google Sheets, and database data into dashboards and reports. It helps people create, refresh, share, and present visual reporting without manual chart building.

ProcessOn is an online diagramming and knowledge-sharing platform for creating mind maps, flowcharts, and related structured visuals. It supports AI-assisted generation, real-time collaboration, and team-oriented document workflows.

Andy is a mood and anxiety tracker for iPhone and Android. It supports quick daily check-ins, optional notes and tags, timeline review, charts, reminders, streaks, share cards, and data export.

Embedful’s Free Chart Generator turns CSV and Excel files into shareable charts without code. It supports multiple chart types, exports PNG/SVG/PDF files, and does not require signup.

Formula Bot è il tuo analista di dati alimentato da IA che trasforma istantaneamente i dati in grafici, approfondimenti, report e altro ancora.