Real-time log streams
Tail stdout and stderr over WebSockets so logs appear in real time without a separate indexing pipeline or polling delay.
DockLog is a self-hosted Docker dashboard for live container logs, host metrics, and basic container administration. It supports RBAC in auth mode and native clients for Android, Windows, and Linux.
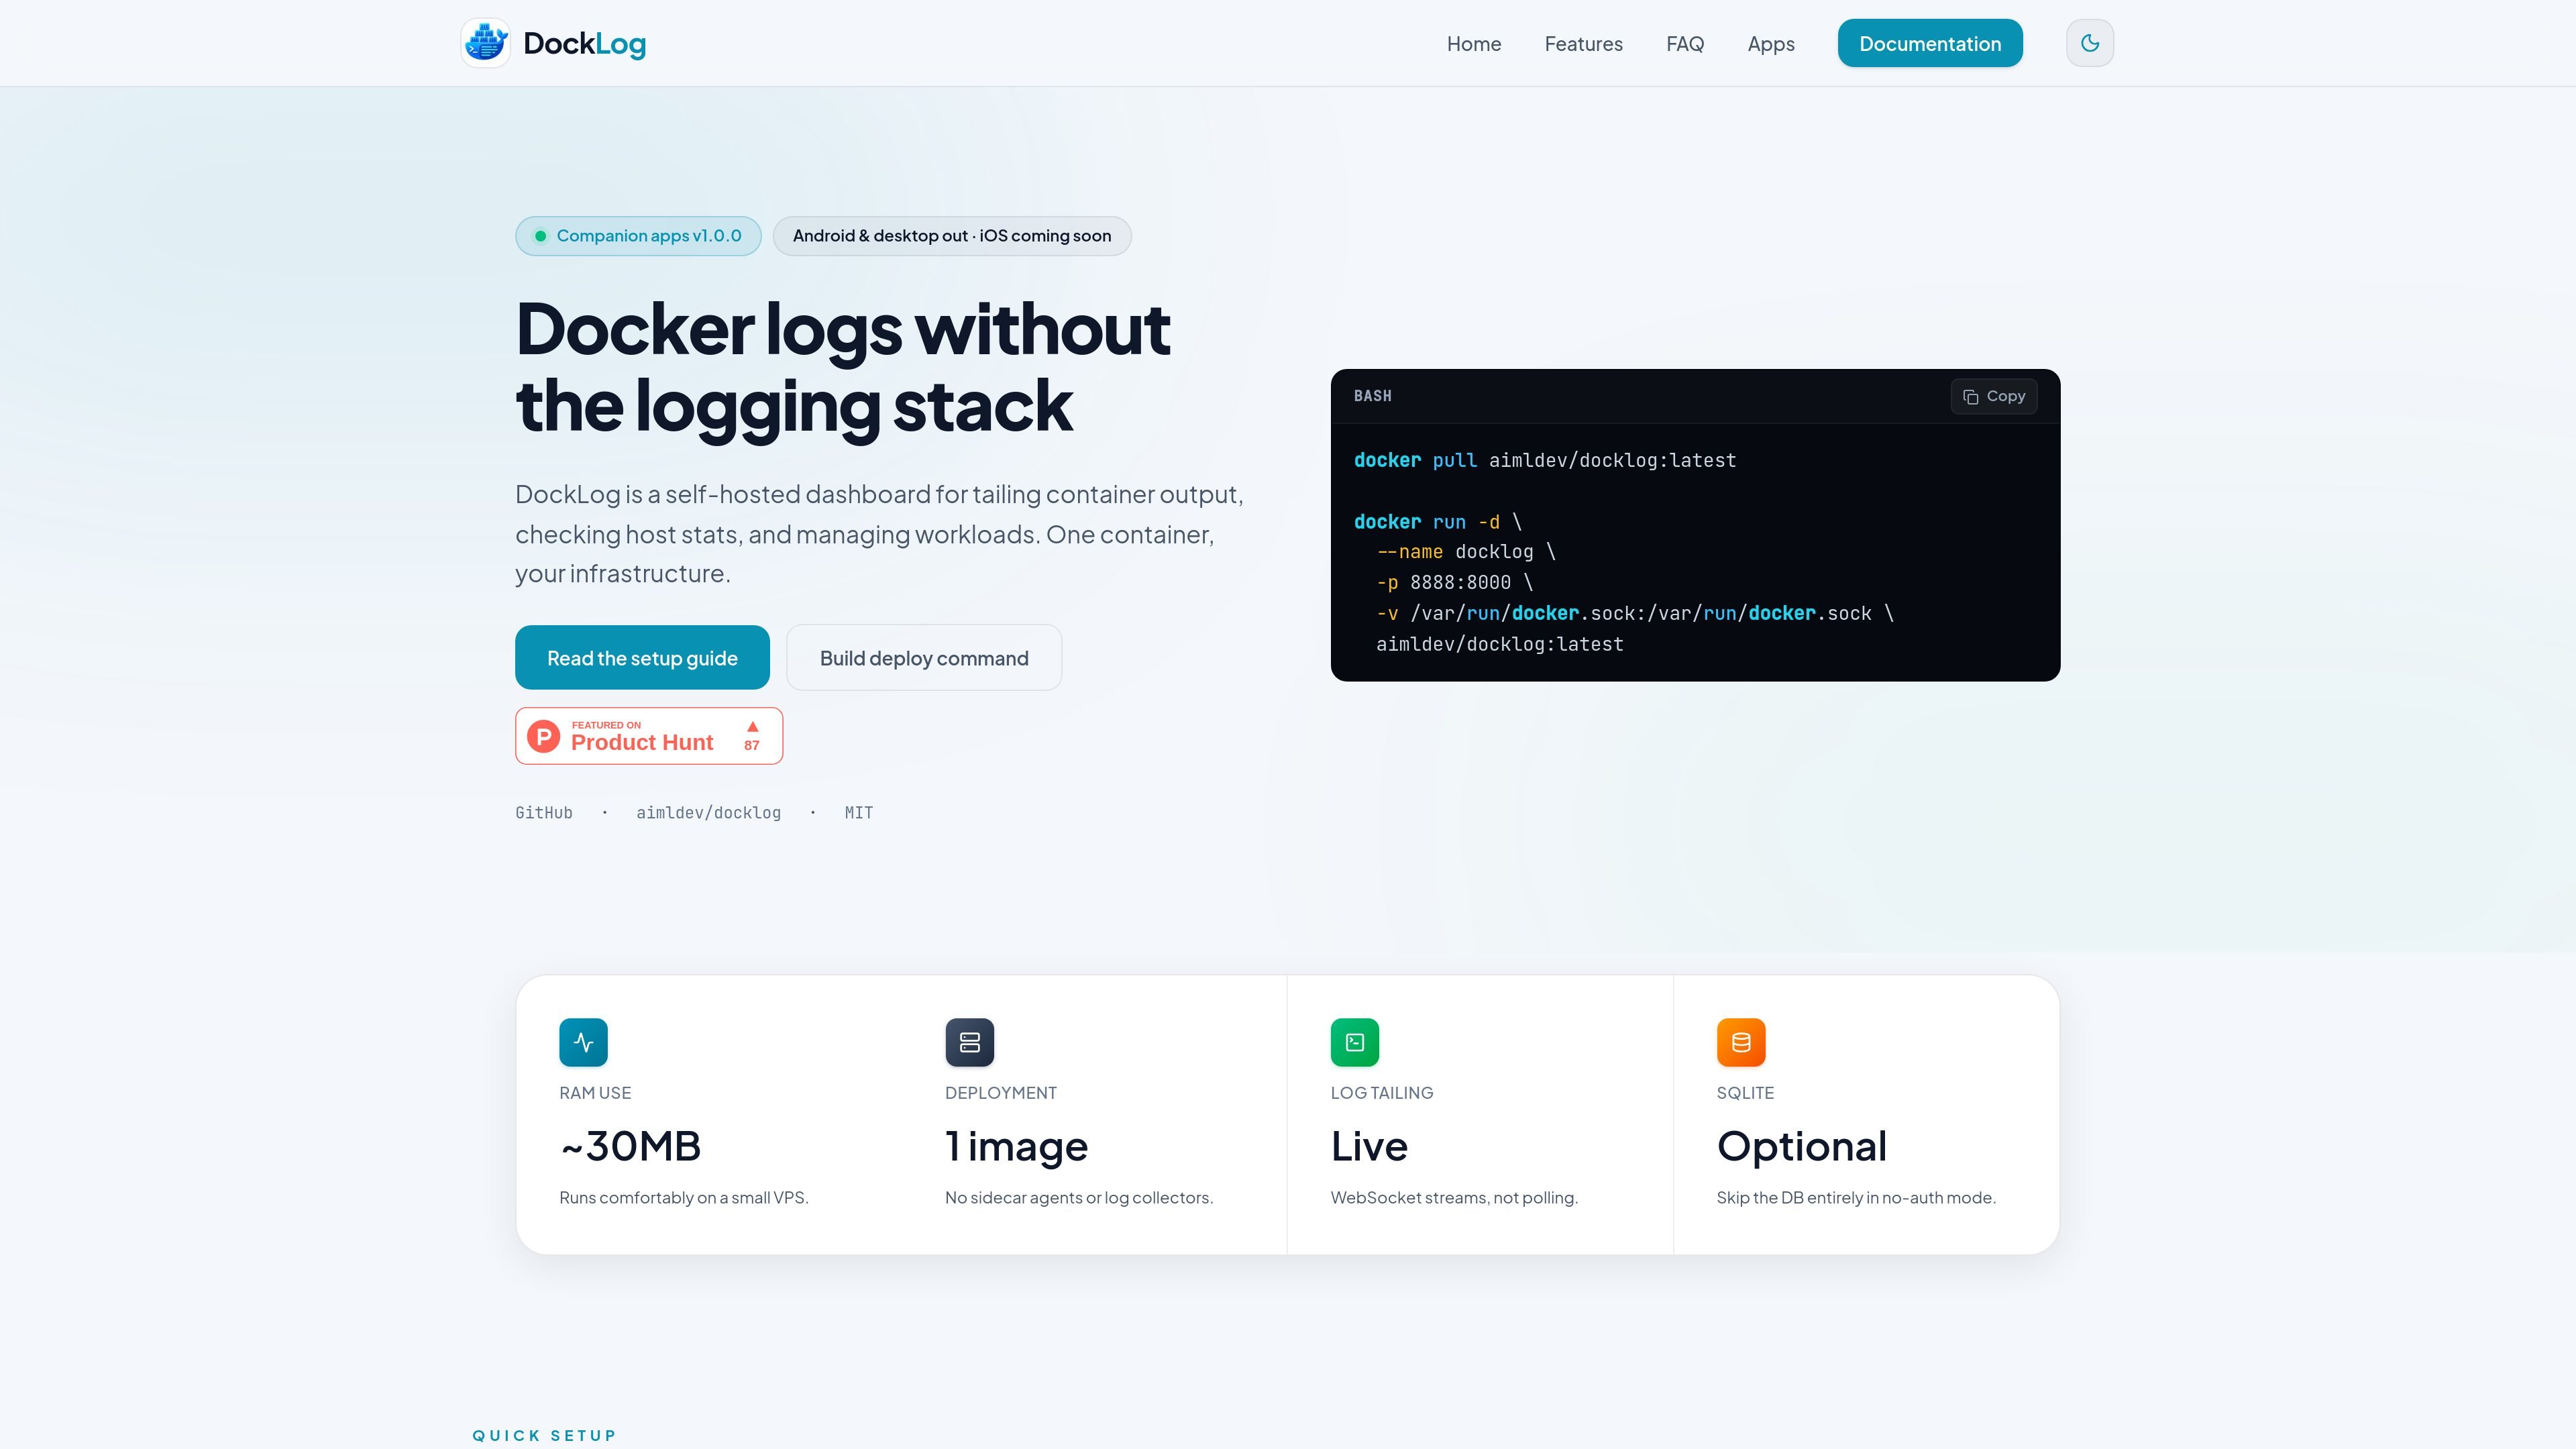
DockLog is a self-hosted Docker dashboard for viewing container logs, checking host performance, and managing workloads from one interface. The product is designed to run on the Docker socket, so it can connect directly to the containers already running on your host.
The site presents DockLog as a lightweight alternative to full logging stacks when you need live log access, basic host metrics, and container actions without adding agents, brokers, or a search cluster. It supports both auth mode for teams and no-auth mode for quick local use, and it also offers native clients for Android, Windows, and Linux that connect back to a DockLog server you host.
Tail stdout and stderr over WebSockets so logs appear in real time without a separate indexing pipeline or polling delay.
Restrict which containers users can see with wildcard or regex rules, and control actions with server-level `ALLOW_*` gates plus per-user `can_*` permissions.
View CPU and memory stats alongside logs, with host and container metrics available in the dashboard and in the native apps.
Start, stop, restart, remove, and optionally open an in-browser shell for containers when permissions allow.
Inspect container metadata, ports, labels, health state, and live logs from a dedicated detail view.
Run the image as a single self-contained container, with optional SQLite persistence for auth mode and no DB required for a quick no-auth setup.
Watch stdout and stderr as containers run, with timestamps, autoscroll, and reconnect behavior for day-to-day debugging.
Give a small team shared dashboard access while limiting which containers each user can see and which actions they can perform.
Track CPU and memory usage next to logs so you can check host load and container behavior without switching tools.
Manage services from the same UI by starting, stopping, restarting, removing, or opening a shell when the deployment allows it.
Use the Android, Windows, or Linux app to connect to a self-hosted server and monitor live logs and metrics away from the browser.
Yes. The web UI and docs show a Docker-based setup that can run in either auth mode or no-auth mode. The app pages also note that native clients connect to a DockLog server you host.
DockLog exposes real-time container logs over WebSockets, so it is built for live tailing rather than delayed polling. The source also describes autoscroll, reconnect, and timestamps in the log stream.
In auth mode, DockLog supports per-user access controls with wildcard or regex-based container visibility rules, plus action permissions for start, stop, restart, delete, and shell access. The server also uses allow flags that gate those actions.
The native app is available for Android, Windows, and Linux. The source says iOS and macOS native apps are not available yet, and Mac users should use the web UI in a browser.
The website documents Docker Compose and plain `docker run` setup, plus reverse-proxy guidance and password recovery. The docs also mention a deployment builder that can generate a Compose file or a `docker run` command.
ClawTick is an AI agent automation platform for scheduling jobs from the CLI, dashboard, or REST API. It is aimed at developers and teams running LangChain, CrewAI, webhook, or custom agent workflows that need monitoring, alerts, and logs.
OpenFlags is an open-source, self-hosted feature flag platform for modern JavaScript teams. It supports local evaluation, targeted rollouts, and controlled launches while keeping flag data in your own infrastructure.
Rectify is an all-in-one SaaS operations platform that combines session replay, monitoring, support, code scanning, roadmaps, and changelogs. It is aimed at founders and product teams, especially non-technical SaaS teams working with AI-assisted development.
PingPulseはAIエージェントのワークフローをリアルタイムで可視化し、引き継ぎの追跡と失敗・停止・順序違いを検知。アラート設定も対応。
Claude Code向けオープンソース観測基盤Latitude。各エージェントターンをセッショントレースで監視し、失敗検知とコスト/利用を可視化。
PromptScout tracks how ChatGPT, Gemini, Google AI Overviews, and Perplexity mention your brand or competitors, then pairs those results with source analysis and website audits. It helps teams decide what to fix in content, positioning, or site readiness next.