ClawMetry for NVIDIA NemoClaw
ClawMetry for NVIDIA NemoClaw adds real-time, structured observability for NemoClaw sandboxes: tool calls, token cost, memory file changes, cron status, encrypted cloud sync.
What is ClawMetry?
ClawMetry for NVIDIA NemoClaw provides real-time, structured observability for NemoClaw sandboxes. Instead of relying only on NemoClaw’s terminal UI, it collects and persists activity such as tool calls, token usage, memory file changes, and scheduled (cron) job status.
The goal is to help you understand what agents are doing at runtime across a NemoClaw fleet, with a web dashboard for live viewing. ClawMetry also performs end-to-end encrypted cloud sync from your host, so telemetry is sent as an encrypted stream.
Key Features
- Host-based one-command deployment for fleet coverage: Run a single install command on the host running NemoClaw to apply a network policy preset to every sandbox instance and begin syncing.
- End-to-end encrypted telemetry to the cloud: An encryption key is generated on the host; only the encrypted telemetry stream reaches ClawMetry Cloud, and prompts/responses and API keys are not sent in the clear.
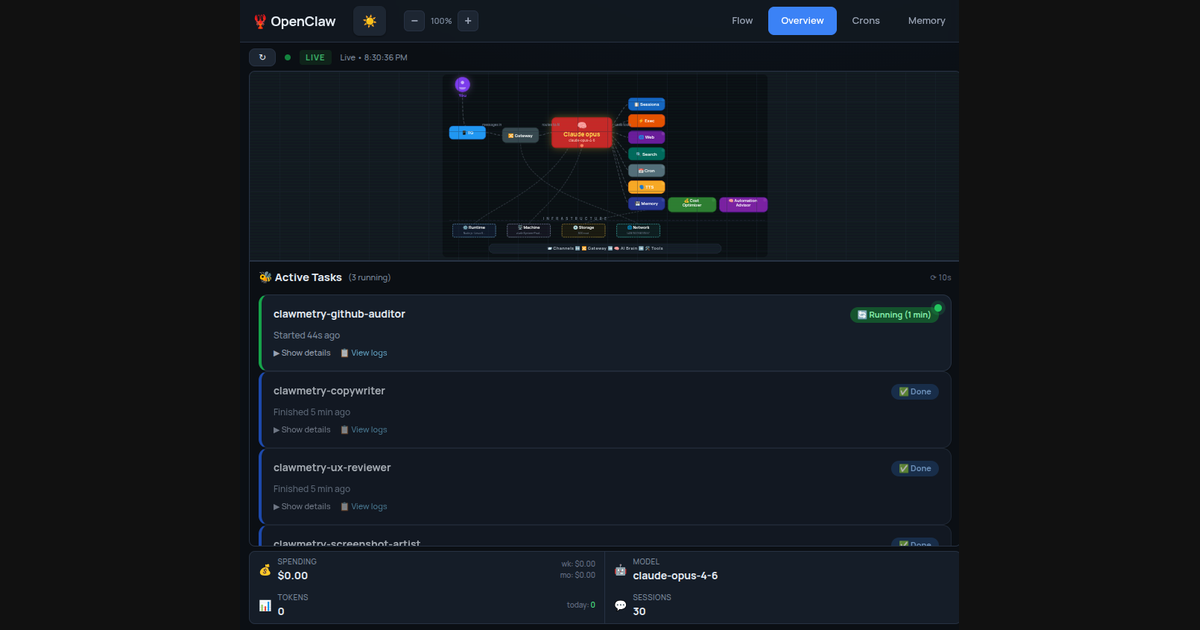
- Live agent activity with per-call detail: See tool calls, token spend, and sub-agent spawn activity in real time from the web dashboard.
- Memory monitoring for key files: Watch
SOUL.mdandMEMORY.mdfor unexpected changes to detect potential memory corruption early. - Token cost tracking: Track token cost per call, daily totals, and monthly projections.
- Cron job monitoring: View cron execution history including last run, next run, and failures without needing to read logs or SSH into instances.
- Web access for live sessions: Access
app.clawmetry.comfrom a browser to monitor live agent sessions and status (mobile is described as “coming soon”). - Built to run alongside OpenShell guardrails: ClawMetry is positioned to observe agent activity without bypassing sandbox policy.
How to Use ClawMetry
- Install on the NemoClaw host: Execute the one-liner installer on the host machine running NemoClaw:
curl -fsSL https://clawmetry.com/install.sh | bash. - Let ClawMetry apply policies and start syncing: The installer applies a network policy preset to all sandboxes automatically and initiates encrypted cloud sync.
- Open the dashboard to observe activity: Use
app.clawmetry.comto view live sessions, token spend per call, memory file diffs, and cron job status.
If a NemoClaw agent is already running in a long-running PTY, you can ask it to install via a prompt like: “Help me install in a long running PTY…”. The agent then downloads the installer, sets up ClawMetry, connects your node, and starts syncing automatically.
Use Cases
- Fleet-wide debugging of agent behavior: Monitor tool calls, token spend, and sub-agent spawn events across multiple NemoClaw sandboxes from a single cloud dashboard view.
- Budget visibility for LLM usage: Track per-call token costs and roll them up into daily totals and monthly projections to understand where costs accumulate.
- Early detection of corrupted agent memory: Continuously watch changes to
SOUL.mdandMEMORY.mdto spot unexpected updates before they cause downstream issues. - Operational monitoring for scheduled tasks: Track cron execution outcomes (last run, next run, and failures) from the dashboard rather than checking each node’s logs.
- Monitoring with security guardrails in place: Observe agent activity while working alongside OpenShell security layers, without attempting to bypass sandbox policy.
FAQ
Is ClawMetry compatible with OpenShell guardrails?
Yes. The documentation states that ClawMetry observability runs alongside NemoClaw’s security layer and is intended to work without bypassing sandbox policy.
How is data protected when sent to the cloud?
ClawMetry generates an encryption key on the host, and it sends an encrypted telemetry stream to ClawMetry Cloud. Prompts, responses, and API keys are described as not leaving your machine in the clear.
What can I see in the dashboard?
From app.clawmetry.com, you can view live agent sessions, token spend per call, memory file diffs for SOUL.md and MEMORY.md, and cron job status.
Do I need to run separate setup per NemoClaw instance?
The workflow described is host-based: running the installer on the NemoClaw host is intended to cover all your NemoClaw instances at once.
What if I already have a long-running NemoClaw agent?
You can ask the existing agent to install ClawMetry in a long-running PTY; it will download the installer, set up ClawMetry, connect your node, and start syncing.
Alternatives
- Rely on NemoClaw’s terminal/UI (TUI) only: This keeps observation local and ephemeral (terminal-only), but it lacks structured, persistent history, cloud dashboard access, and fleet-wide views described for ClawMetry.
- Build custom logging/telemetry around agent tool calls: You could instrument your agent runtime to record tool calls, tokens, and events, but you would need to implement persistence, dashboards, and encrypted transport yourself.
- General-purpose infrastructure observability (metrics/logs/APM): Tools in this category focus on host/service metrics and logs; they may not provide NemoClaw-specific visibility like memory file diffs (
SOUL.md,MEMORY.md) or per-agent tool-call token accounting out of the box.
Alternatives
Rectify
Rectify is an all-in-one operations platform for SaaS, combining monitoring, analytics, support, roadmaps, changelogs, and agent management—via conversation.
PromptScout
PromptScout tracks how your brand is mentioned, which competitors are recommended, and what sources are cited in AI answers—plus website audits.
Sleek Analytics
Lightweight, privacy-friendly analytics with real-time visitor tracking—see where visitors come from, what they view, and how long they stay.
ClawTick
ClawTick is a CLI-first AI agent automation platform for scheduling webhook tasks on cron with monitoring, alerts, retries, and execution logs.
OpenFlags
OpenFlags is an open source, self-hosted feature flag system with a control plane and typed SDKs for progressive delivery and safe rollouts.
skills-janitor
Audit, track usage, and compare your Claude Code skills with skills-janitor—nine focused slash commands and zero dependencies.