
Local per-call measurement
Measures provider-reported usage, pricing evidence, request and response metadata, status, timing, retry evidence, and detector signals for calls the proxy actually sees.

inferock-bench is a local diagnostic proxy for LLM API traffic that records per-call usage, failures, and timing, then generates receipts for billing-integrity review. It is aimed at teams and individuals auditing token usage or investigating whether failed calls affected billing.
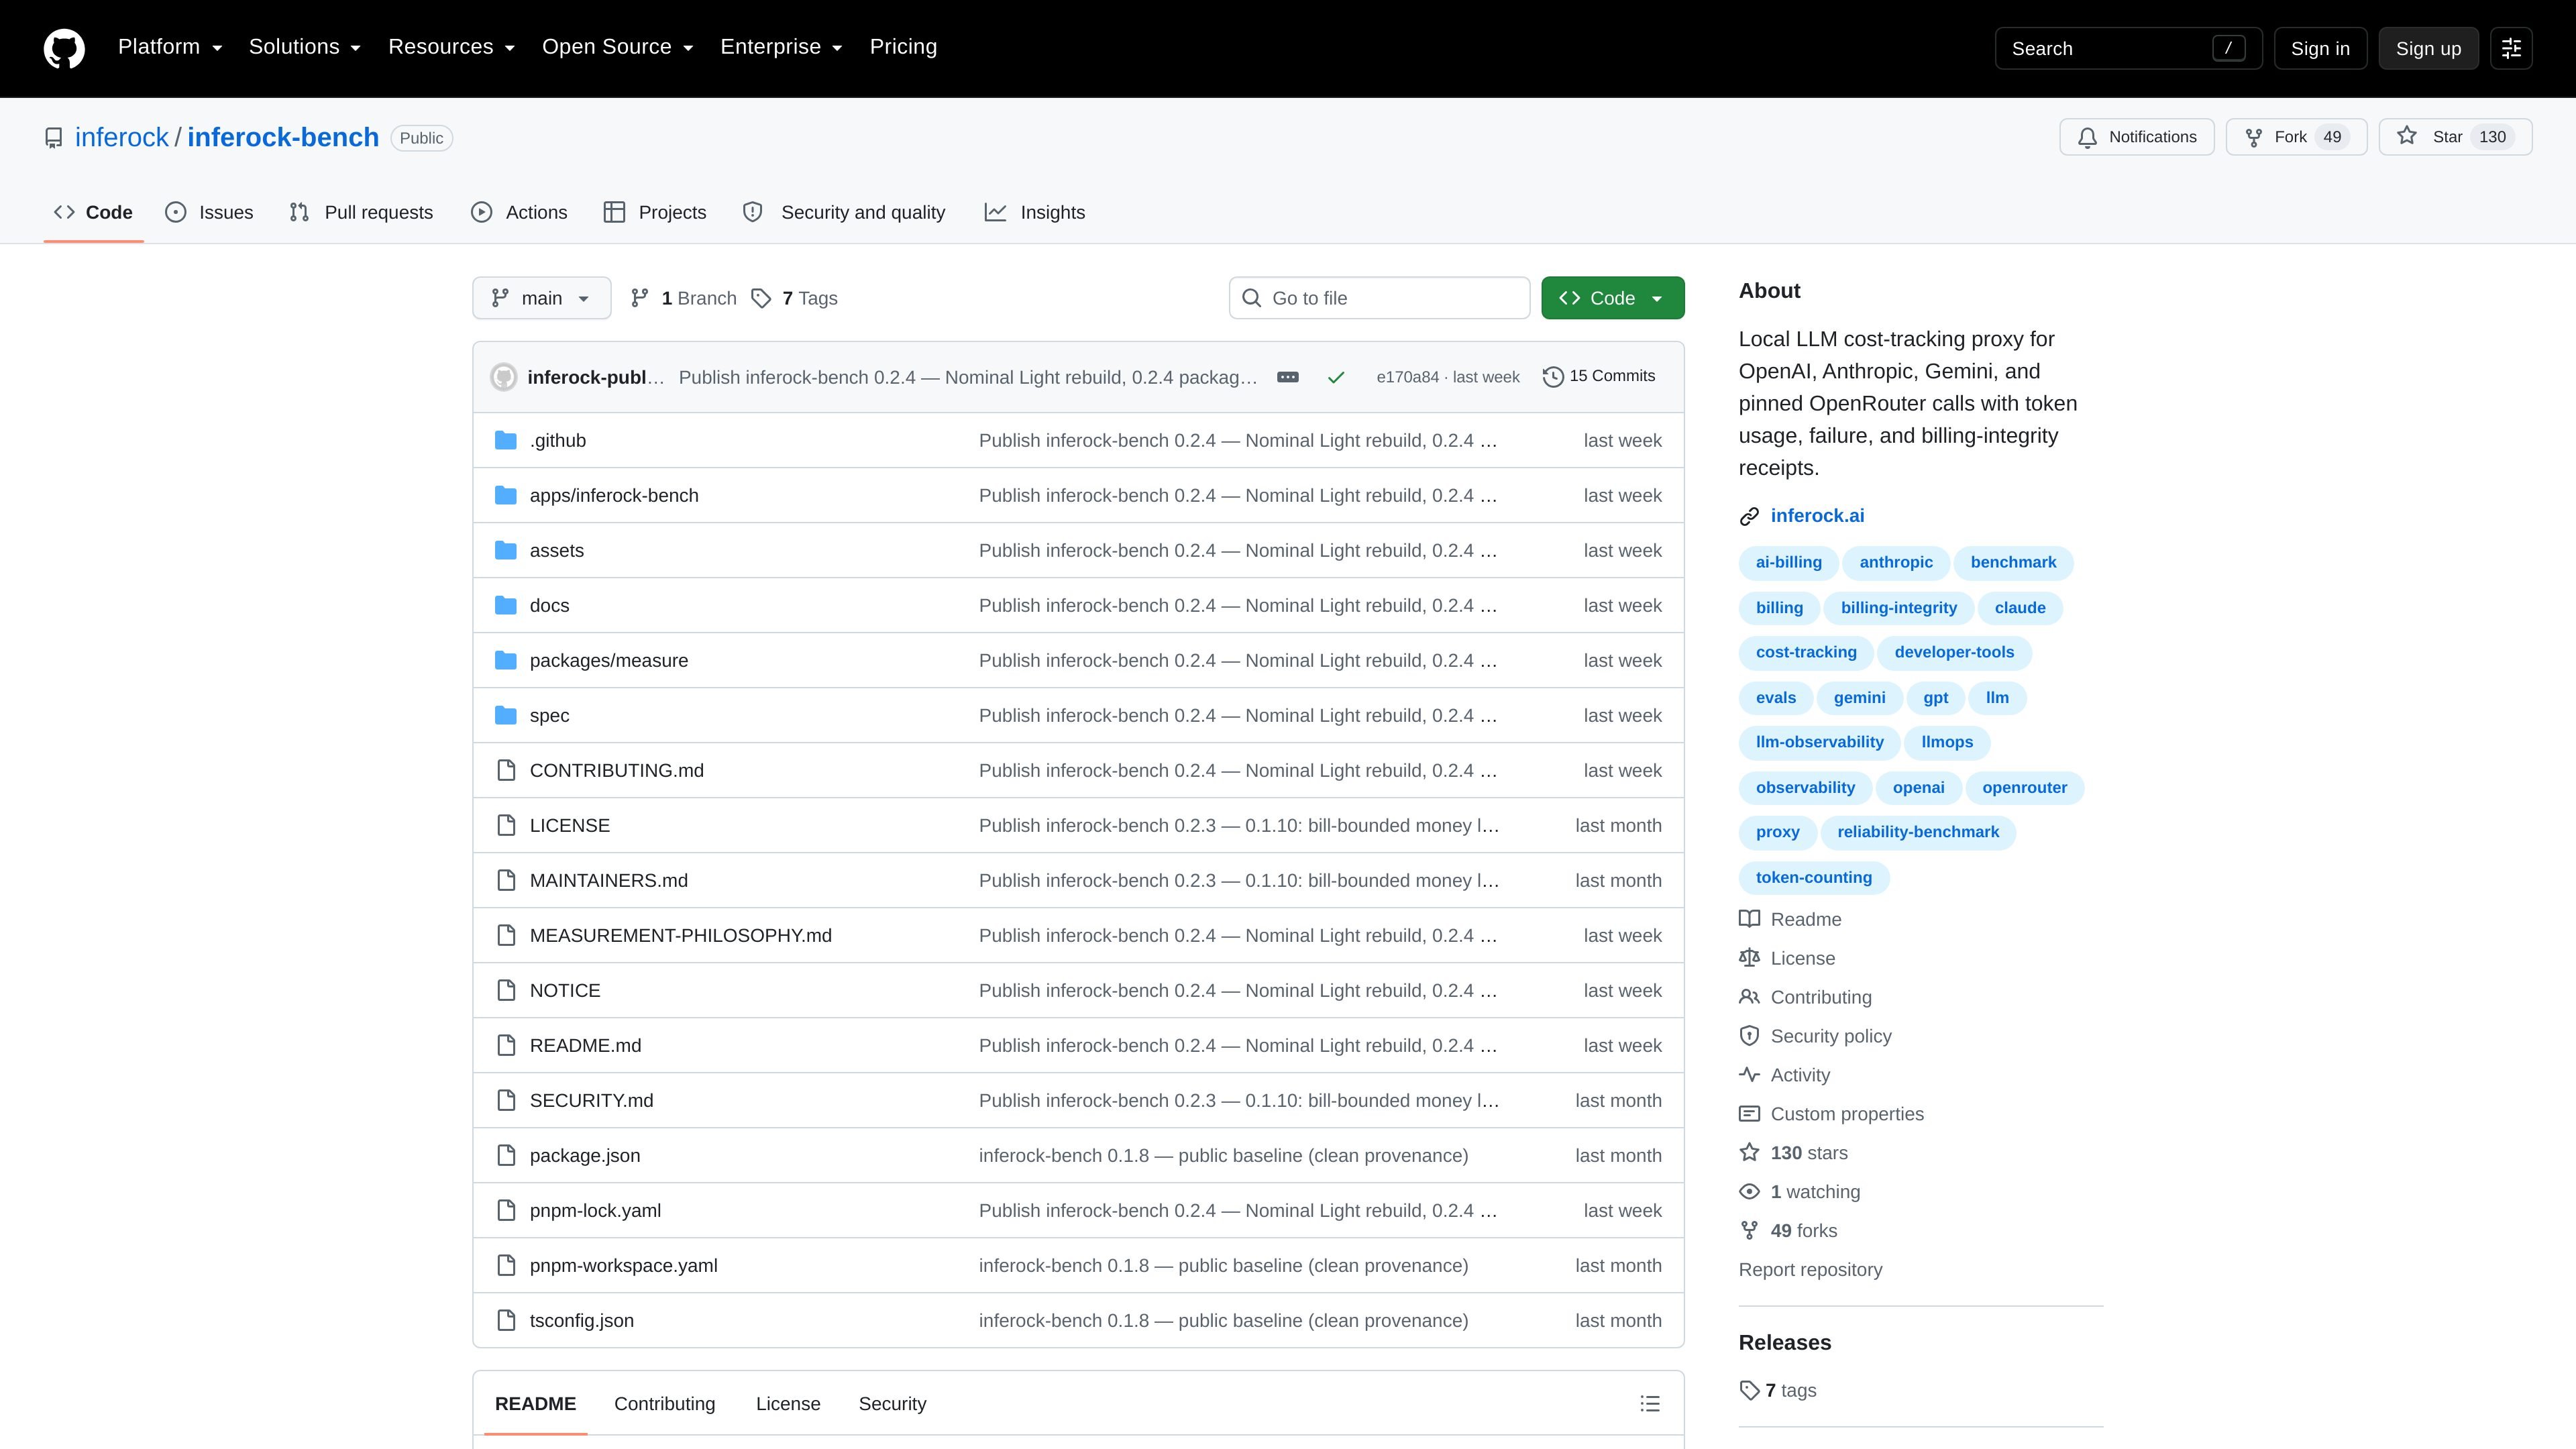
inferock-bench is a local diagnostic proxy for metered LLM API traffic. It routes requests through localhost, records per-call events, and turns those events into receipts that summarize usage, timing, failures, and billing-related signals.
The project is aimed at people who need to inspect AI spend and billing integrity at the call level. The README frames it as a way to audit an AI or LLM bill, check token usage locally, and investigate whether a failed API call may still have been billed.
Measures provider-reported usage, pricing evidence, request and response metadata, status, timing, retry evidence, and detector signals for calls the proxy actually sees.
Records delivery failures that can affect billing or audit trails, including billed-empty output, refusals, truncation, token-recount mismatches, duplicate request IDs, cache-discount-at-risk evidence, and provider-fault retries.
Labels each surface as watched-clean, signal, or not-openable so users can see when a check is unopened instead of assuming a clean result.
Generates receipts from stored event records using the shipped @inferock/measure grading code and The Inferock Standard.
Keeps provider keys local to the proxy workflow and does not send them to Inferock; receipts remain local unless shared by the user.
Targets four measured provider planes while remaining extensible for other surfaces that are not yet measured today.
Use the proxy when you want a per-call record of what was billed, what failed, and what timing or retry evidence was attached to the request.
Use it to inspect token usage locally for provider calls routed through your own machine before you rely on invoice totals or dashboard summaries.
Use the receipt output when a failed request may still have affected billing, especially for cases involving empty output, refusals, truncation, or retry behavior.
Use the coverage-state labels to see whether a surface was watched cleanly, produced signals, or was not openable in the measured run.
Use the local records and receipts when you need evidence you can keep in your own environment rather than sending provider keys or raw billing data to a third party.
It is a local diagnostic proxy that measures calls routed through localhost with your provider API key, then renders receipts from the recorded events. The README describes it as a local LLM cost-tracking proxy for OpenAI, Anthropic, Gemini Developer API, and pinned OpenRouter endpoints.
The README names OpenAI, Anthropic, Gemini Developer API, and pinned OpenRouter endpoints as the measured provider planes. It also says the OpenRouter coverage includes observed hosts such as meta-llama, deepseek, mistral, moonshot/kimi, z-ai/glm, and qwen.
The project is meant to help you audit an AI or LLM bill, measure token usage locally, and investigate whether a failed API call may still have affected billing. It is especially focused on per-call receipts and billing-integrity questions.
The benchmark writes local event records and produces receipts using the shipped @inferock/measure grading code and The Inferock Standard. The README emphasizes that receipts are local unless you choose to share them.
No. The README says it cannot audit traffic that bypasses the local proxy, cap provider spend across unseen calls, or explain a monthly bill without the matching invoice. It also notes that anything outside the measured surfaces is extensible-by-design, not measured today.

ByteAsk is a terminal-first AI coding agent for C and C++ that edits repositories and verifies changes with the real compiler, debugger, sanitizers, and tests before showing a diff. It offers a free tier plus paid plans, with editor connectors and zero-retention handling described in the source.

Manta AI is an autonomous web app testing tool for teams that want to map application behavior, catch regressions, and generate tests without writing scripts or maintaining selectors. It works from a URL and supports plain-English test flows, run results with screenshots, and scheduled or deployment-triggered checks.

PromptScout tracks how ChatGPT, Gemini, Google AI Overviews, and Perplexity mention your brand or competitors, then pairs those results with source analysis and website audits. It helps teams decide what to fix in content, positioning, or site readiness next.

CreateOS Sandbox is an isolated compute environment for running code and agent workloads inside Firecracker micro-VMs. It is designed for workflows that need machine-level isolation, private networking between sandboxes, and programmatic control through SDK, CLI, or MCP.

Sleek Analytics is a privacy-friendly web analytics tool with real-time visitor tracking, Core Web Vitals, and revenue attribution. It helps site owners understand traffic and conversions without cookie banners or a heavy setup.

hob is an independent workspace for coding agents that keeps agent sessions, terminals, history, and follow-up work organized around the tools and providers you already use. It is aimed at developers who want local control over routing, history, and workspace structure rather than a bundled model stack.