
Error tracking
Groups frontend and backend errors so one broken deploy becomes one problem queue, not a long stream of logs.

Optics QA is a web platform for error tracking, session replay, monitoring, load testing, pentest, and issue creation. It helps teams capture failures, review the session behind them, and turn findings into assigned work.
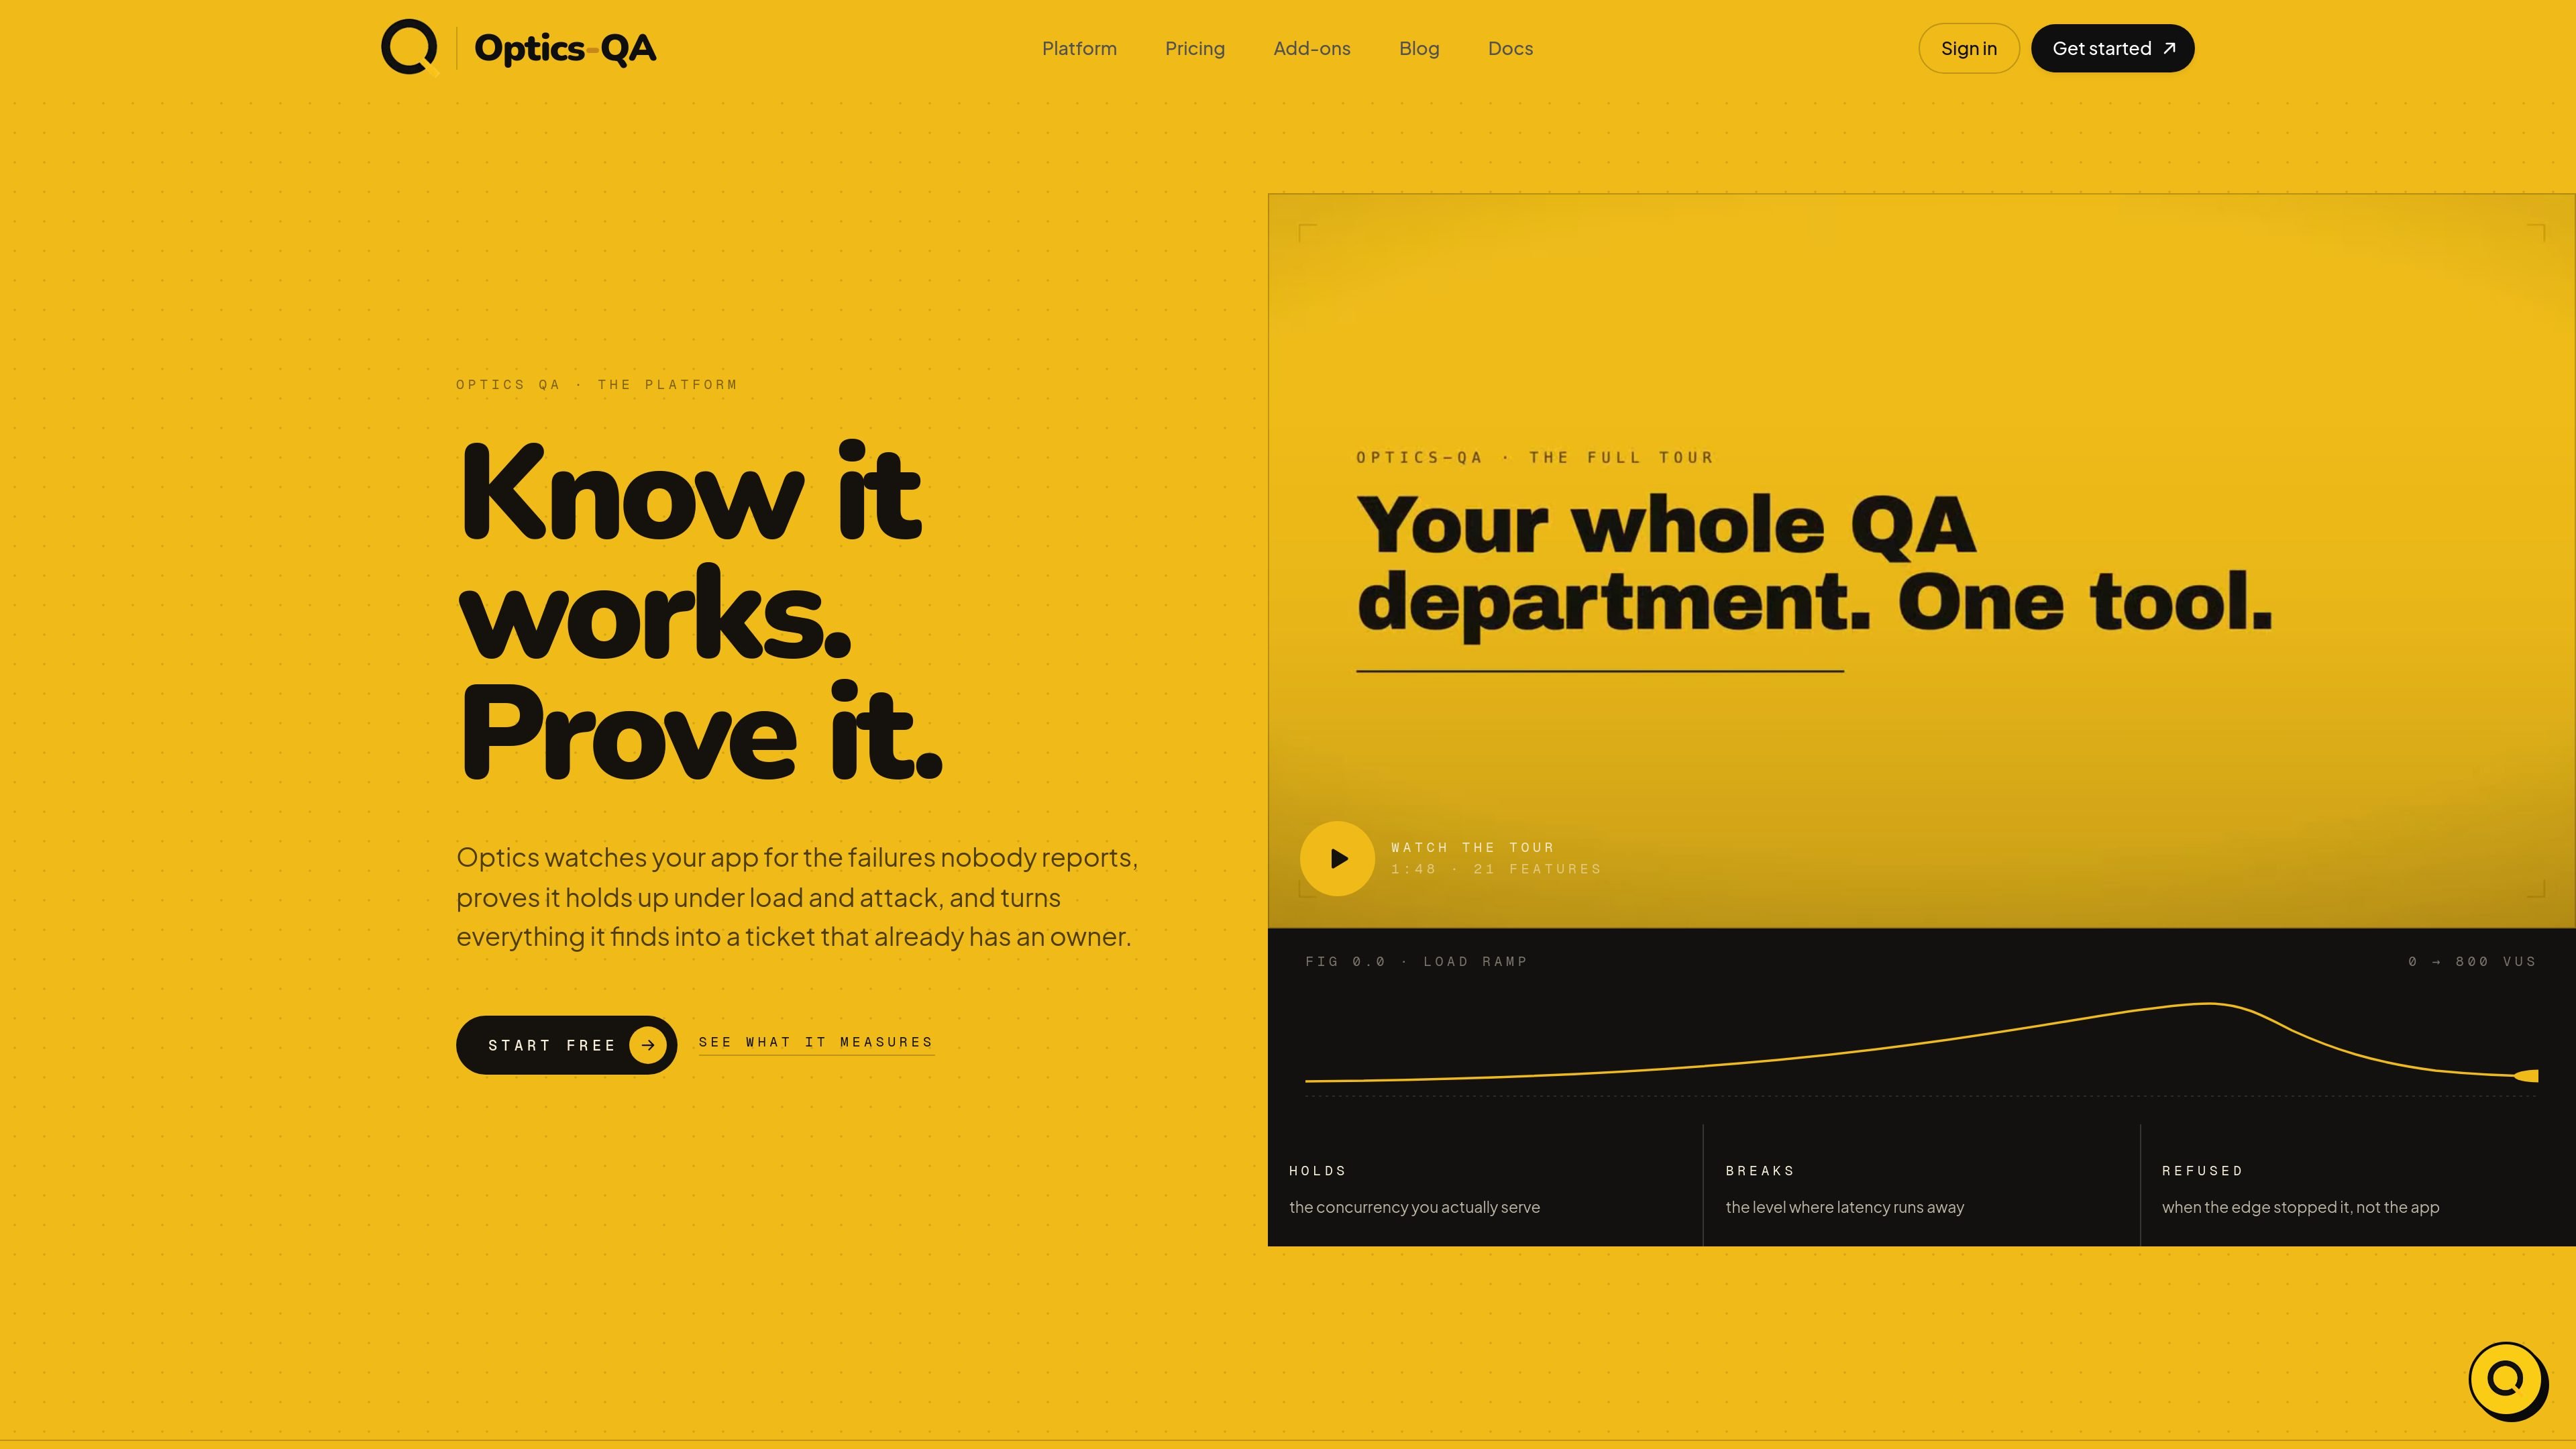
Optics QA is a product platform for watching, validating, and documenting how an application behaves in production and under test. Across the pages provided, it combines error tracking, session replay, uptime and page-speed monitoring, pentest, load testing, DDoS resilience, and issue creation in one workflow.
The core promise is to catch failures that users do not report, prove how the system holds up under stress, and convert what it finds into work that already has context. Installation is presented as a single script tag in the page head, with an extension available if you want to record the same data without touching production code.
Groups frontend and backend errors so one broken deploy becomes one problem queue, not a long stream of logs.
Records the document as it changes, with replay stored per session in chunks so you can jump to the point of failure.
Checks uptime and page speed around the clock to show whether the site is available and how it behaves over time.
Runs graded security passes and load tests, including DDoS resilience, so you can see how the app behaves under attack and load.
Turns bugs into assigned tickets, with issues built from captured data rather than manual triage.
Keeps regressions, test suites, releases, and SOC 2 readiness inside the same platform workflows.
Use Optics when a frontend or backend failure needs to be grouped, owned, and worked as a queue instead of hunted through raw logs.
Use the recorded DOM session to inspect what the user saw at the moment the problem happened, especially when the issue is hard to reproduce.
Use monitoring, load testing, and DDoS resilience to check whether the site stays up and holds its ceiling under stress before users find the limit.
Use pentest output as a graded security pass that can be shared with a customer or stakeholder as proof of a security review.
Use issues and team-oriented workflows when a group needs bugs, fixes, and reports to land in the tools and backlog the team already uses.
Yes. The site says Optics can be installed with one script tag in the page head, and it also offers an extension that records the same kind of data without changing production code. Removing the script tag cancels the install.
Optics appears to be aimed at teams that want error tracking, session replay, monitoring, pentest, load testing, DDoS resilience, and issue generation in one product. The pricing page distinguishes between a Pro plan for solo builders and a Team plan for teams that ship daily.
Captured errors are grouped into queues, session replays are attached to the relevant error and ticket, and issues are created as tickets that are already assigned. The platform page also shows supporting surfaces like regressions, test suites, releases, and SOC 2 readiness.
The source pages do not list third-party integrations by name. They do say that Team plan bugs land in the tools your team already lives in, but no specific integrations are shown on the pages provided.
The site says personal data is masked at the SDK boundary before anything is sent, and session replay records the DOM rather than screenshots or video. It also says data is captured in chunks per session and the replay survives deploys.

ByteAsk is a terminal-first AI coding agent for C and C++ that edits repositories and verifies changes with the real compiler, debugger, sanitizers, and tests before showing a diff. It offers a free tier plus paid plans, with editor connectors and zero-retention handling described in the source.

Manta AI is an autonomous web app testing tool for teams that want to map application behavior, catch regressions, and generate tests without writing scripts or maintaining selectors. It works from a URL and supports plain-English test flows, run results with screenshots, and scheduled or deployment-triggered checks.

EAS Observe is a production performance monitoring tool for Expo and React Native apps. It shows startup metrics, session timelines, release markers, and errors inside the Expo dashboard.

PromptScout tracks how ChatGPT, Gemini, Google AI Overviews, and Perplexity mention your brand or competitors, then pairs those results with source analysis and website audits. It helps teams decide what to fix in content, positioning, or site readiness next.

CreateOS Sandbox is an isolated compute environment for running code and agent workloads inside Firecracker micro-VMs. It is designed for workflows that need machine-level isolation, private networking between sandboxes, and programmatic control through SDK, CLI, or MCP.

Sleek Analytics is a privacy-friendly web analytics tool with real-time visitor tracking, Core Web Vitals, and revenue attribution. It helps site owners understand traffic and conversions without cookie banners or a heavy setup.