
Local per-call measurement
Measures provider-reported usage, pricing evidence, request and response metadata, status, timing, retry evidence, and detector signals for calls the proxy actually sees.

inferock-bench is a local diagnostic proxy for LLM API traffic that records per-call usage, failures, and timing, then generates receipts for billing-integrity review. It is aimed at teams and individuals auditing token usage or investigating whether failed calls affected billing.
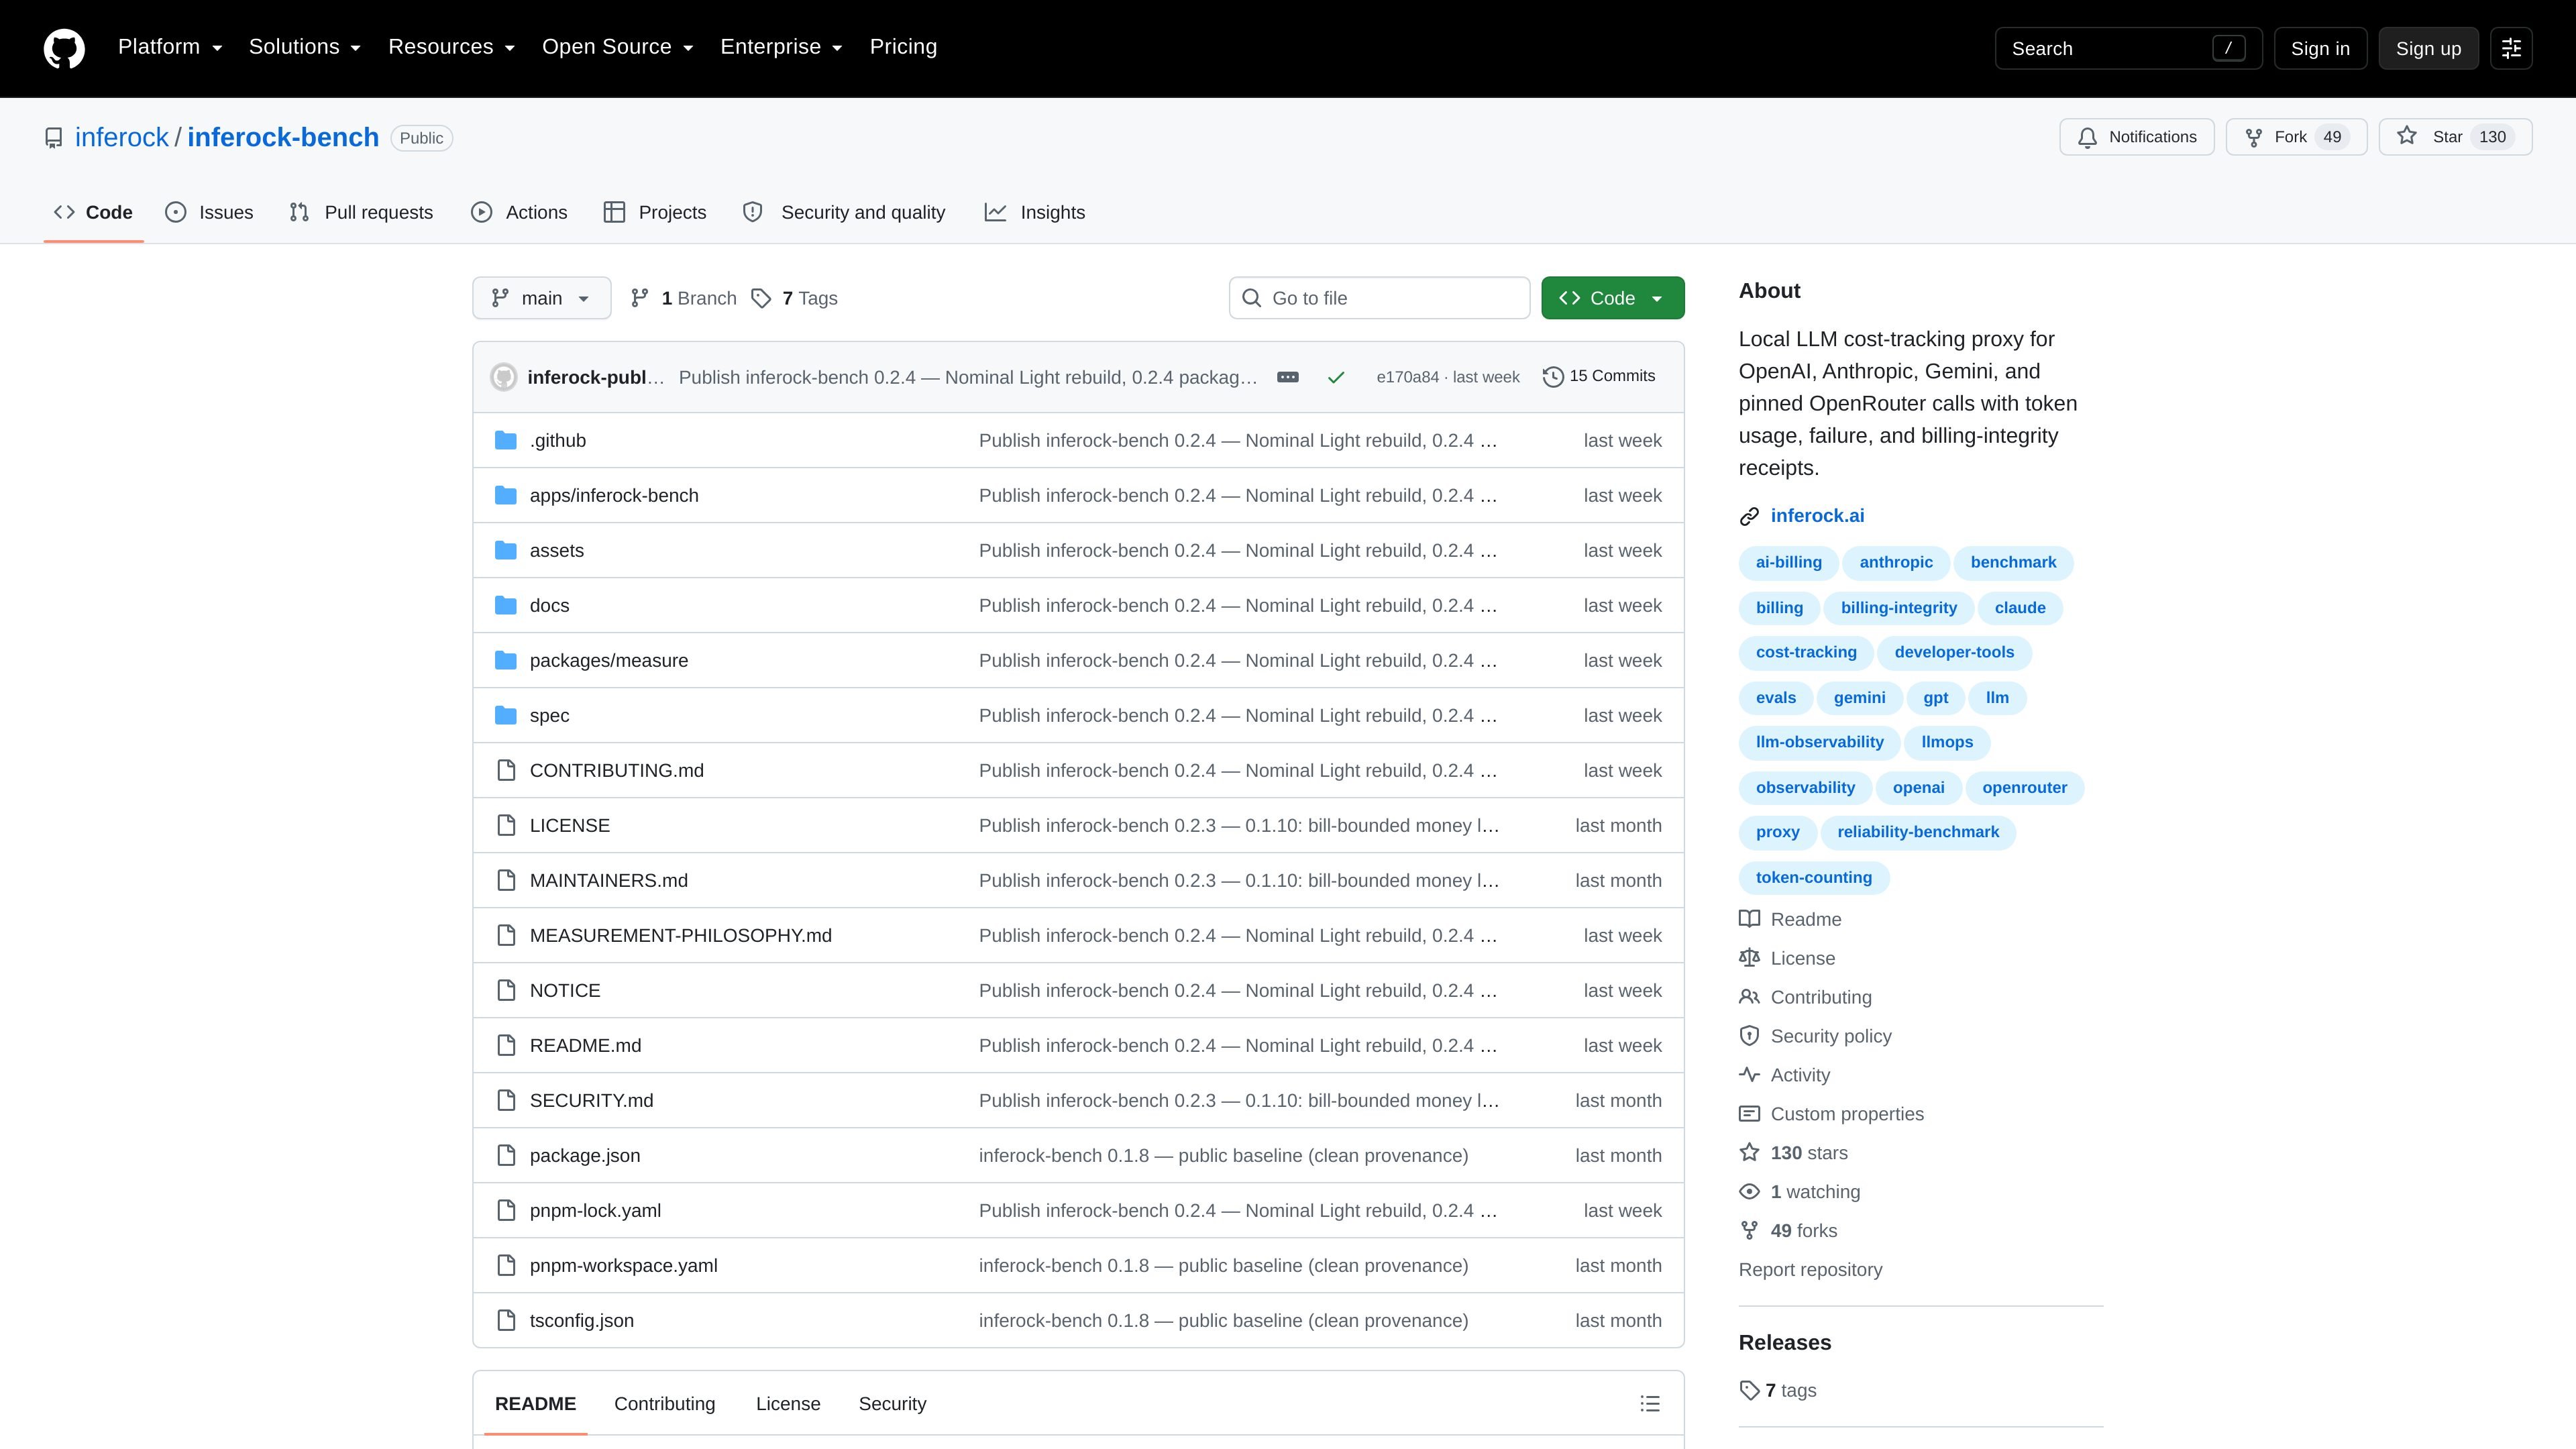
inferock-bench is a local diagnostic proxy for metered LLM API traffic. It routes requests through localhost, records per-call events, and turns those events into receipts that summarize usage, timing, failures, and billing-related signals.
The project is aimed at people who need to inspect AI spend and billing integrity at the call level. The README frames it as a way to audit an AI or LLM bill, check token usage locally, and investigate whether a failed API call may still have been billed.
Measures provider-reported usage, pricing evidence, request and response metadata, status, timing, retry evidence, and detector signals for calls the proxy actually sees.
Records delivery failures that can affect billing or audit trails, including billed-empty output, refusals, truncation, token-recount mismatches, duplicate request IDs, cache-discount-at-risk evidence, and provider-fault retries.
Labels each surface as watched-clean, signal, or not-openable so users can see when a check is unopened instead of assuming a clean result.
Generates receipts from stored event records using the shipped @inferock/measure grading code and The Inferock Standard.
Keeps provider keys local to the proxy workflow and does not send them to Inferock; receipts remain local unless shared by the user.
Targets four measured provider planes while remaining extensible for other surfaces that are not yet measured today.
Use the proxy when you want a per-call record of what was billed, what failed, and what timing or retry evidence was attached to the request.
Use it to inspect token usage locally for provider calls routed through your own machine before you rely on invoice totals or dashboard summaries.
Use the receipt output when a failed request may still have affected billing, especially for cases involving empty output, refusals, truncation, or retry behavior.
Use the coverage-state labels to see whether a surface was watched cleanly, produced signals, or was not openable in the measured run.
Use the local records and receipts when you need evidence you can keep in your own environment rather than sending provider keys or raw billing data to a third party.
It is a local diagnostic proxy that measures calls routed through localhost with your provider API key, then renders receipts from the recorded events. The README describes it as a local LLM cost-tracking proxy for OpenAI, Anthropic, Gemini Developer API, and pinned OpenRouter endpoints.
The README names OpenAI, Anthropic, Gemini Developer API, and pinned OpenRouter endpoints as the measured provider planes. It also says the OpenRouter coverage includes observed hosts such as meta-llama, deepseek, mistral, moonshot/kimi, z-ai/glm, and qwen.
The project is meant to help you audit an AI or LLM bill, measure token usage locally, and investigate whether a failed API call may still have affected billing. It is especially focused on per-call receipts and billing-integrity questions.
The benchmark writes local event records and produces receipts using the shipped @inferock/measure grading code and The Inferock Standard. The README emphasizes that receipts are local unless you choose to share them.
No. The README says it cannot audit traffic that bypasses the local proxy, cap provider spend across unseen calls, or explain a monthly bill without the matching invoice. It also notes that anything outside the measured surfaces is extensible-by-design, not measured today.

ByteAsk 是面向 C 和 C++ 的终端优先 AI 编码 agent,可直接编辑仓库,并在展示 diff 前用真实编译器、调试器、sanitizers 和测试验证修改。提供免费版与付费方案。

Manta AI 是面向团队的自治式网页应用测试工具,可从 URL 自动探索应用、映射行为、捕捉回归,并用自然语言生成测试,无需脚本或维护选择器。

PromptScout 监测 ChatGPT、Gemini、Google AI Overviews 和 Perplexity 如何提及你的品牌或竞争对手,并结合来源分析和网站审计,帮助团队决定下一步优化内容、定位或站点准备度。

CreateOS Sandbox 是基于 Firecracker 微型虚拟机的隔离计算环境,用于运行代码和 agent 工作负载,支持私有网络、SDK、CLI 和 MCP 程序化控制。

Sleek Analytics 是一款注重隐私的网页分析工具,支持实时访客追踪、Core Web Vitals 和收入归因。无需 cookie 横幅,安装轻量,帮助站点主了解流量与转化。

hob 是面向编码 agent 的独立工作区,可将 agent 会话、终端、历史记录和后续工作围绕你已在用的工具与提供商有序管理,适合重视本地路由、历史和工作区结构控制的开发者。