Data import and migration
Upload existing locations from CSV, or migrate from MapCustomizer in one click. The site also mentions CSV and Excel import for imported maps and location data.
Create Mappins is a web-based map maker for interactive maps with custom pins, markers, and annotations for travel, business, events, and education.
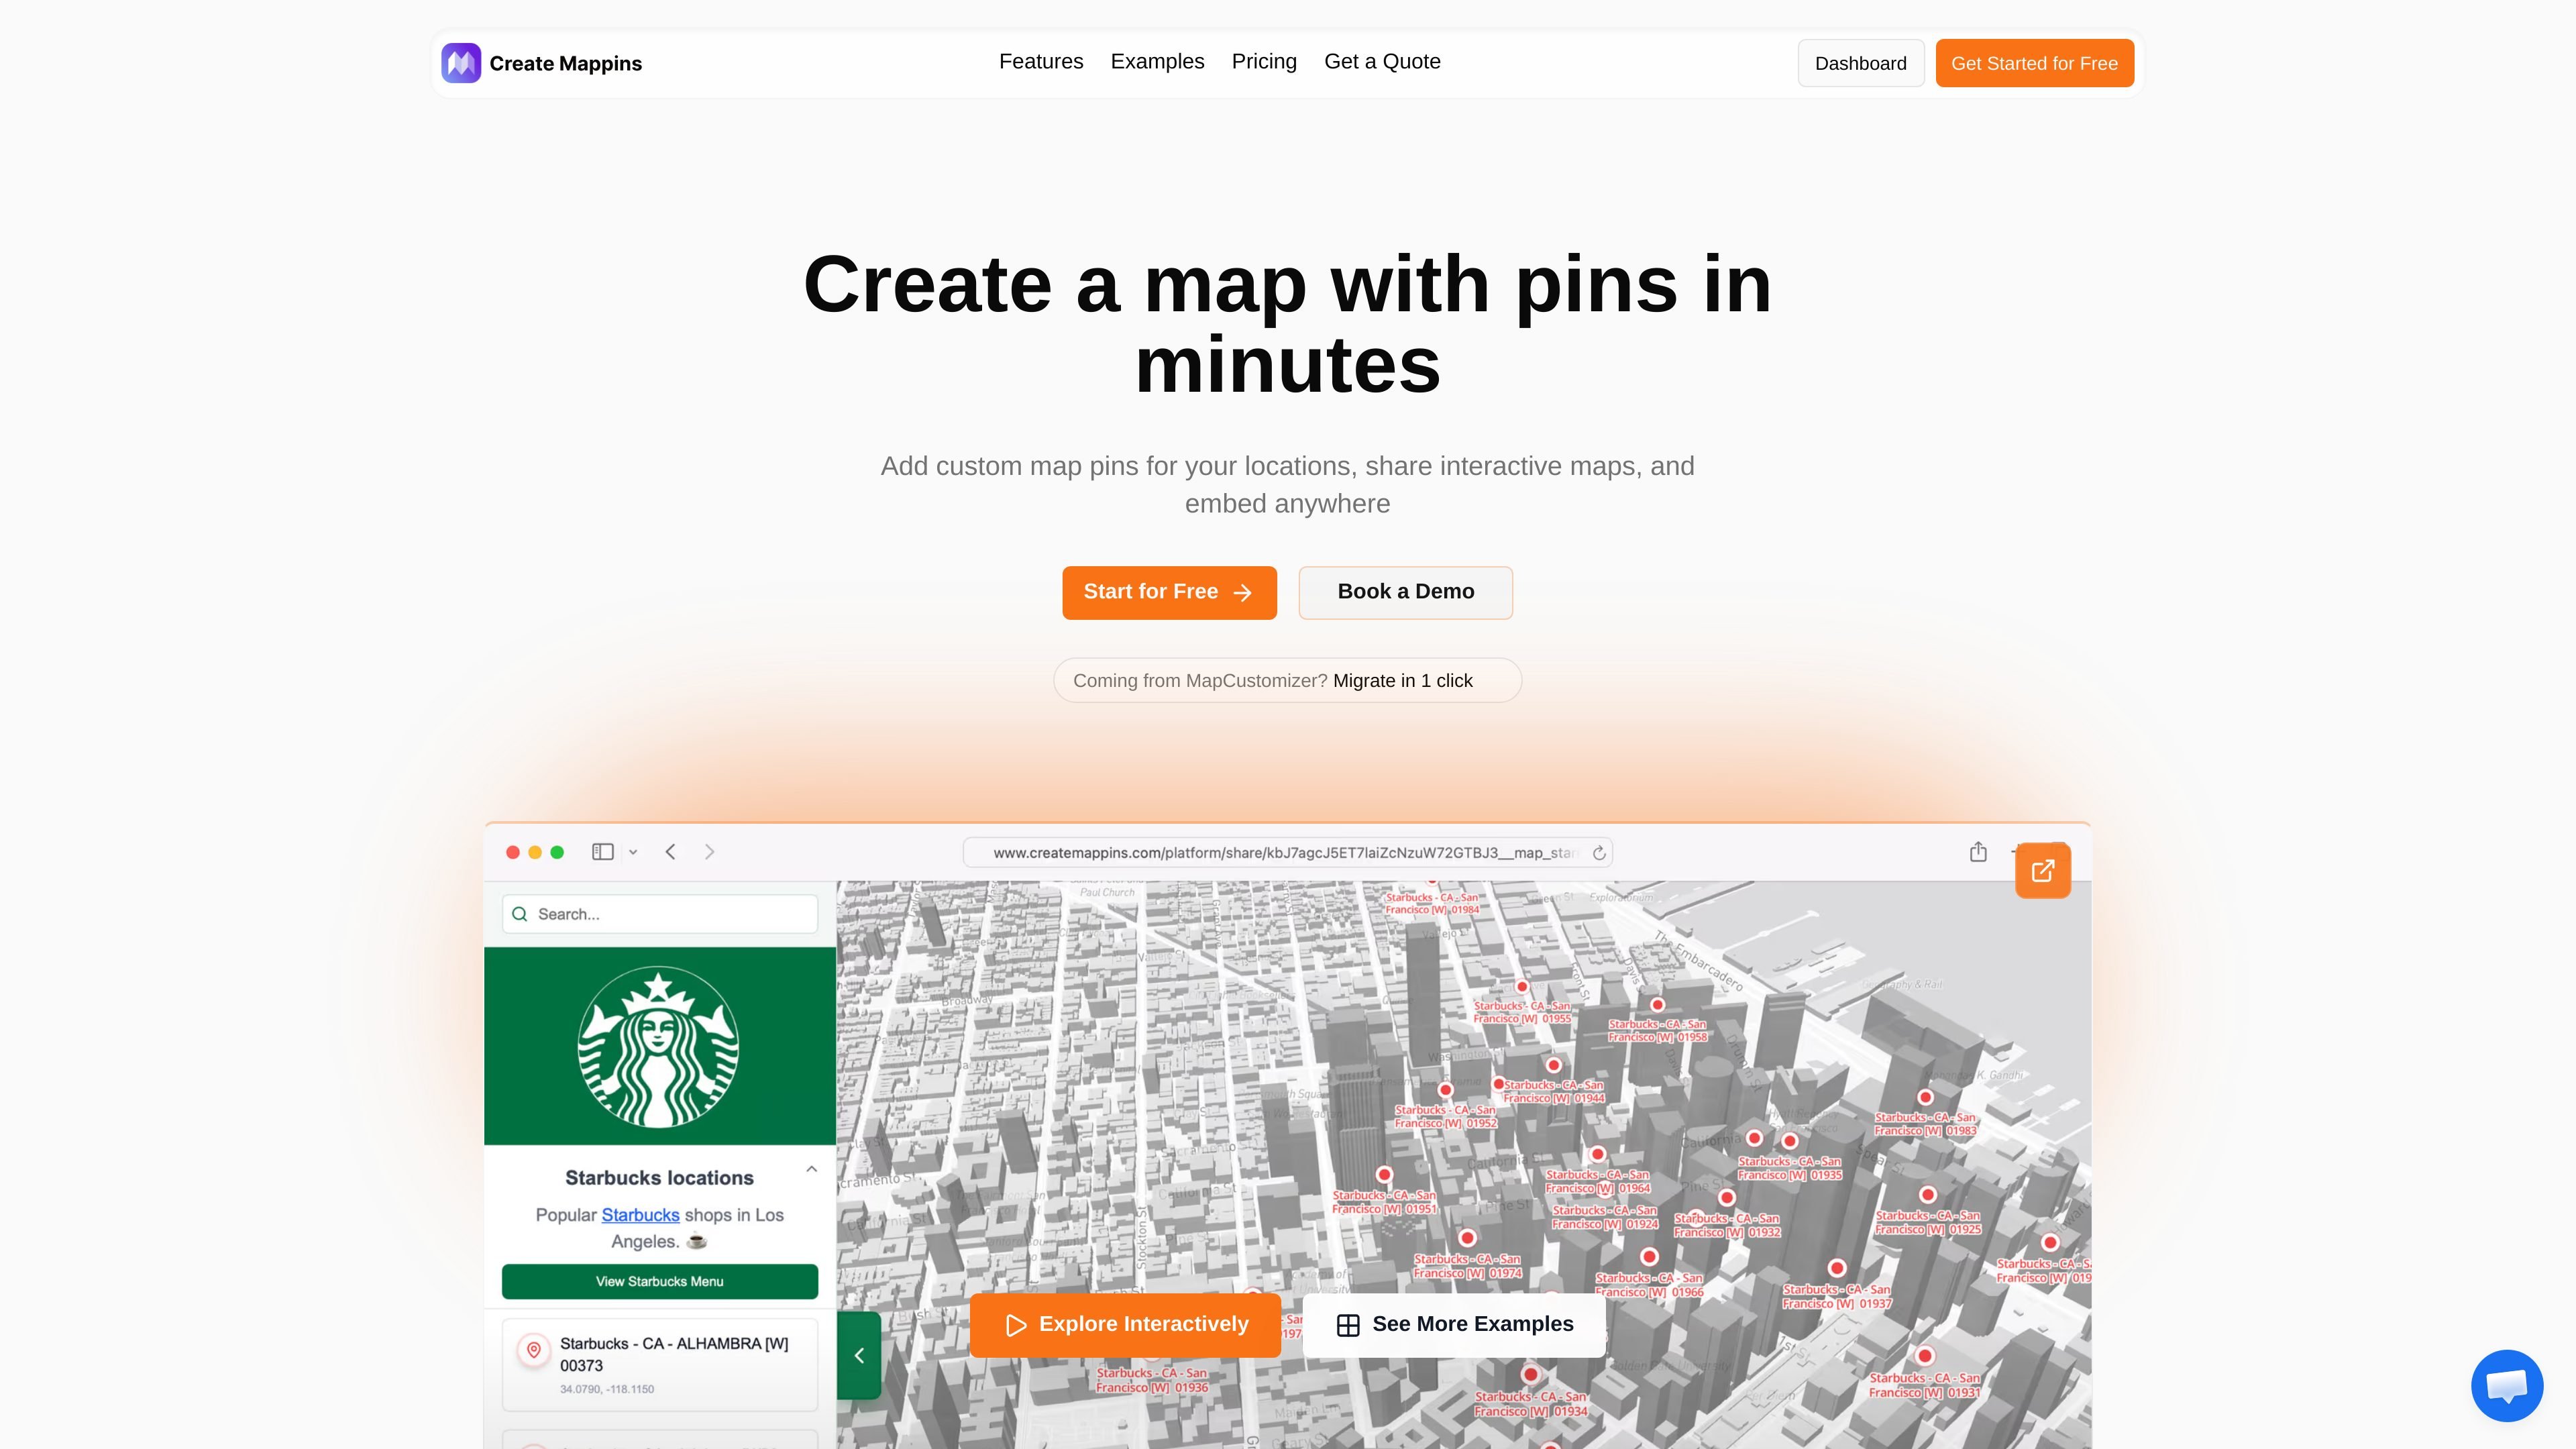
Create Mappins is a web app for building interactive maps with custom pins. It is positioned for practical mapping tasks such as travel planning, business location mapping, event coordination, real estate listings, and educational geography work.
The workflow centers on importing locations, placing pins on a live map, and then adding context through layers, clustering, routes, regions, and overlays. Finished maps can be shared by link or embedded on a website, and the product offers a free tier plus paid plans for more advanced styling, imports, branding, and collaboration.
Upload existing locations from CSV, or migrate from MapCustomizer in one click. The site also mentions CSV and Excel import for imported maps and location data.
Pin business locations, branches, properties, venues, or other points on a live map. The product supports custom pin colors, icons, and styles, plus image markers and photos on pins.
Add overlays such as competitors, partners, demographics, logistics zones, regions, routes, and pin clusters to add more context to a map.
Share maps through public links or secure links, embed them on websites, and use password protection or domain-restricted embed on paid plans.
Keep maps tied to an account, sign in with email or Google, and access maps from any device. The sign-in page also describes save-and-return workflows for ongoing edits.
View engagement data such as views, pin interactions, and region-level activity. The site notes deeper reporting and collaboration controls for Enterprise and some options enabled on request.
Plot destinations, hotels, restaurants, and attractions on a custom map, then share it with others or keep editing from any device.
Map store networks, branches, service areas, or logistics zones to support operations, expansion planning, and territory review.
Create interactive venue maps for conferences, meetings, or community events and share them with attendees or teams.
Show property listings, neighborhood coverage, or available units on a map that can be embedded on listings or shared with agents and buyers.
Build geography lessons, historical maps, or subject-specific visualizations using pins, regions, and custom overlays.
Create Mappins is a web-based map maker for creating interactive maps with custom pins, markers, and annotations. The source describes uses such as travel planning, business locations, event mapping, and educational geography resources.
Yes. The sign-in page says you can create a free account, and the pricing page shows a Free plan that lets you try the product and share your first maps at no cost.
Yes. The site says you can share maps through public links or secure links, embed them on a website, and use password-protected maps on paid plans.
Yes. The migration page says you can import from MapCustomizer in one click by pasting a MapCustomizer URL, and the product also supports CSV import.
The sign-in page says maps are saved to your account, can be accessed from any device, and support collaborative use on higher-tier plans or on request for Enterprise.
Sour Mango is a free iOS and Android travel app for digital nomads with AI trip planning, visa tracking, translation, currency conversion, and community features.
MeetPoint compares live flight prices from multiple origins to find the cheapest place for a group to meet, with filters for budget, stops, and flight duration.
ClawApp is a MacOS desktop app for using OpenClaw bots with no setup or technical knowledge required. Natural-language workflows for email, notes, travel, code, and chat coordination.
Sunny Days Ahead is a free travel discovery web app for finding sunny destinations month by month with historical weather data, climate insights, and side-by-side comparisons.
Poker Planner helps poker players plan live or online tournament trips on a budget, avoid schedule clashes, and track results and ROI.
SF Trip Planner is a web app for planning San Francisco trips around events, saved spots, and neighborhood safety on one map. Export to Google Calendar or ICS.