OrangeLabs
OrangeLabs: Empowering non-tech pros with intuitive data visualization & natural language querying for raw data insights.
What is OrangeLabs?
OrangeLabs is a revolutionary data visualization platform designed to democratize data analysis for everyone. It empowers individuals without technical expertise to directly interact with their raw data, ask questions in natural language, and generate insightful, interactive visualizations. Gone are the days of relying on data scientists or complex BI tools; OrangeLabs puts the power of data exploration directly into the hands of business users, marketers, and decision-makers.
Our mission is to bridge the gap between raw data and actionable insights. By offering an intuitive, conversational interface, OrangeLabs transforms the often daunting process of data analysis into a simple, engaging experience. Whether you're looking to understand customer behavior, track sales performance, or identify market trends, OrangeLabs provides the tools to uncover hidden patterns and make data-driven decisions with confidence.
Key Features
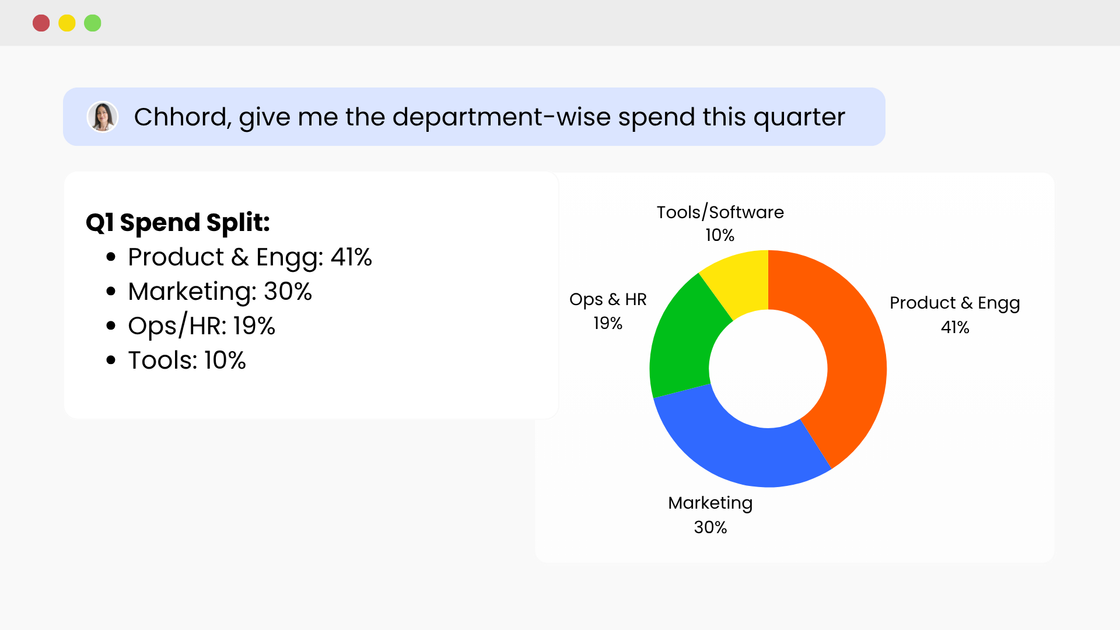
- Natural Language Querying: Ask questions about your data using plain English, just like you would talk to a colleague. OrangeLabs understands your intent and translates it into data queries.
- Interactive Visualizations: Instantly generate a variety of charts, graphs, and dashboards that dynamically update as you refine your queries or explore different data points.
- No-Code Interface: Designed for non-technical users, OrangeLabs requires no coding or complex setup. Simply upload your data and start exploring.
- Raw Data Connectivity: Connect directly to your raw data sources without the need for extensive data preparation or warehousing.
- Collaboration Tools: Share your insights and visualizations with team members, fostering a data-driven culture across your organization.
- Customizable Dashboards: Build personalized dashboards that display the most critical metrics and visualizations relevant to your role and objectives.
- AI-Powered Insights: Leverage artificial intelligence to uncover trends, anomalies, and correlations you might have missed.
How to Use OrangeLabs
Getting started with OrangeLabs is designed to be straightforward and intuitive:
- Upload Your Data: Connect to your data sources or upload files directly into the OrangeLabs platform. We support various common data formats.
- Ask a Question: In the main interface, type your question about the data in natural language. For example, "Show me the total sales by region for last quarter" or "What are the top 5 products by customer rating?"
- Explore Visualizations: OrangeLabs will instantly generate an interactive visualization based on your query. You can then click on elements, filter data, or ask follow-up questions to dive deeper.
- Build Dashboards: Save your favorite visualizations and arrange them into custom dashboards for ongoing monitoring and reporting.
- Share Insights: Collaborate with your team by sharing dashboards, specific charts, or insights directly from the platform.
Use Cases
OrangeLabs is versatile and can benefit a wide range of professionals and industries:
- Marketing Teams: Analyze campaign performance, understand customer segmentation, track website traffic, and measure ROI without needing SQL expertise.
- Sales Professionals: Monitor sales pipelines, identify top-performing regions or products, forecast revenue, and understand customer purchasing patterns.
- Small Business Owners: Gain quick insights into financial performance, inventory management, and customer feedback to make informed business decisions.
- Product Managers: Track user engagement, analyze feature adoption, and gather feedback to prioritize product development.
- HR Departments: Analyze employee demographics, track recruitment metrics, and understand employee satisfaction trends.
FAQ
Q: Do I need any technical skills to use OrangeLabs? A: Absolutely not! OrangeLabs is specifically designed for non-technical professionals. Our natural language interface allows you to query data and build visualizations without writing any code.
Q: What kind of data sources can I connect to? A: OrangeLabs supports direct uploads of common file formats like CSV and Excel. We are continuously expanding our connectivity options to include databases and cloud storage solutions.
Q: Is there a free trial available? A: Yes, we offer a free trial period so you can experience the full power of OrangeLabs before committing to a subscription.
Q: How secure is my data with OrangeLabs? A: Data security is our top priority. We employ industry-standard security measures to protect your data and ensure privacy. Please refer to our Security Policy for more details.
Q: Can I export my visualizations? A: Yes, you can export your generated charts and dashboards in various formats (e.g., PNG, PDF) for use in presentations or reports.
Alternatives
Bricks
Bricks is the easiest way to turn your CSV & Excel files into beautiful, editable dashboards - no setup required.
PromptScout
PromptScout tracks how your brand is mentioned, which competitors are recommended, and what sources are cited in AI answers—plus website audits.
SaveMRR
SaveMRR scans Stripe billing data to find SaaS MRR leaks and help recover failed payments, save cancellations, and win back churn—60-sec Free Revenue Scan.
Sleek Analytics
Lightweight, privacy-friendly analytics with real-time visitor tracking—see where visitors come from, what they view, and how long they stay.
Struere
Struere is an AI-native operational system that replaces spreadsheet workflows with structured software—dashboards, alerts, and automations.
ClayHog
ClayHog tracks AI Search Visibility & GEO—see what ChatGPT, Gemini, Perplexity, Claude, and Google AI Overviews say about your brand, incl. citations and sentiment.