AI-assisted spreadsheet work
Ask questions in natural language and let Quadratic generate formulas, Python, or SQL cells to work through the logic. The product emphasizes readable, auditable outputs instead of opaque answers.
Quadratic is an AI spreadsheet for live analysis, connected data, and auditable workflows, with web app, MCP clients, and REST API access.
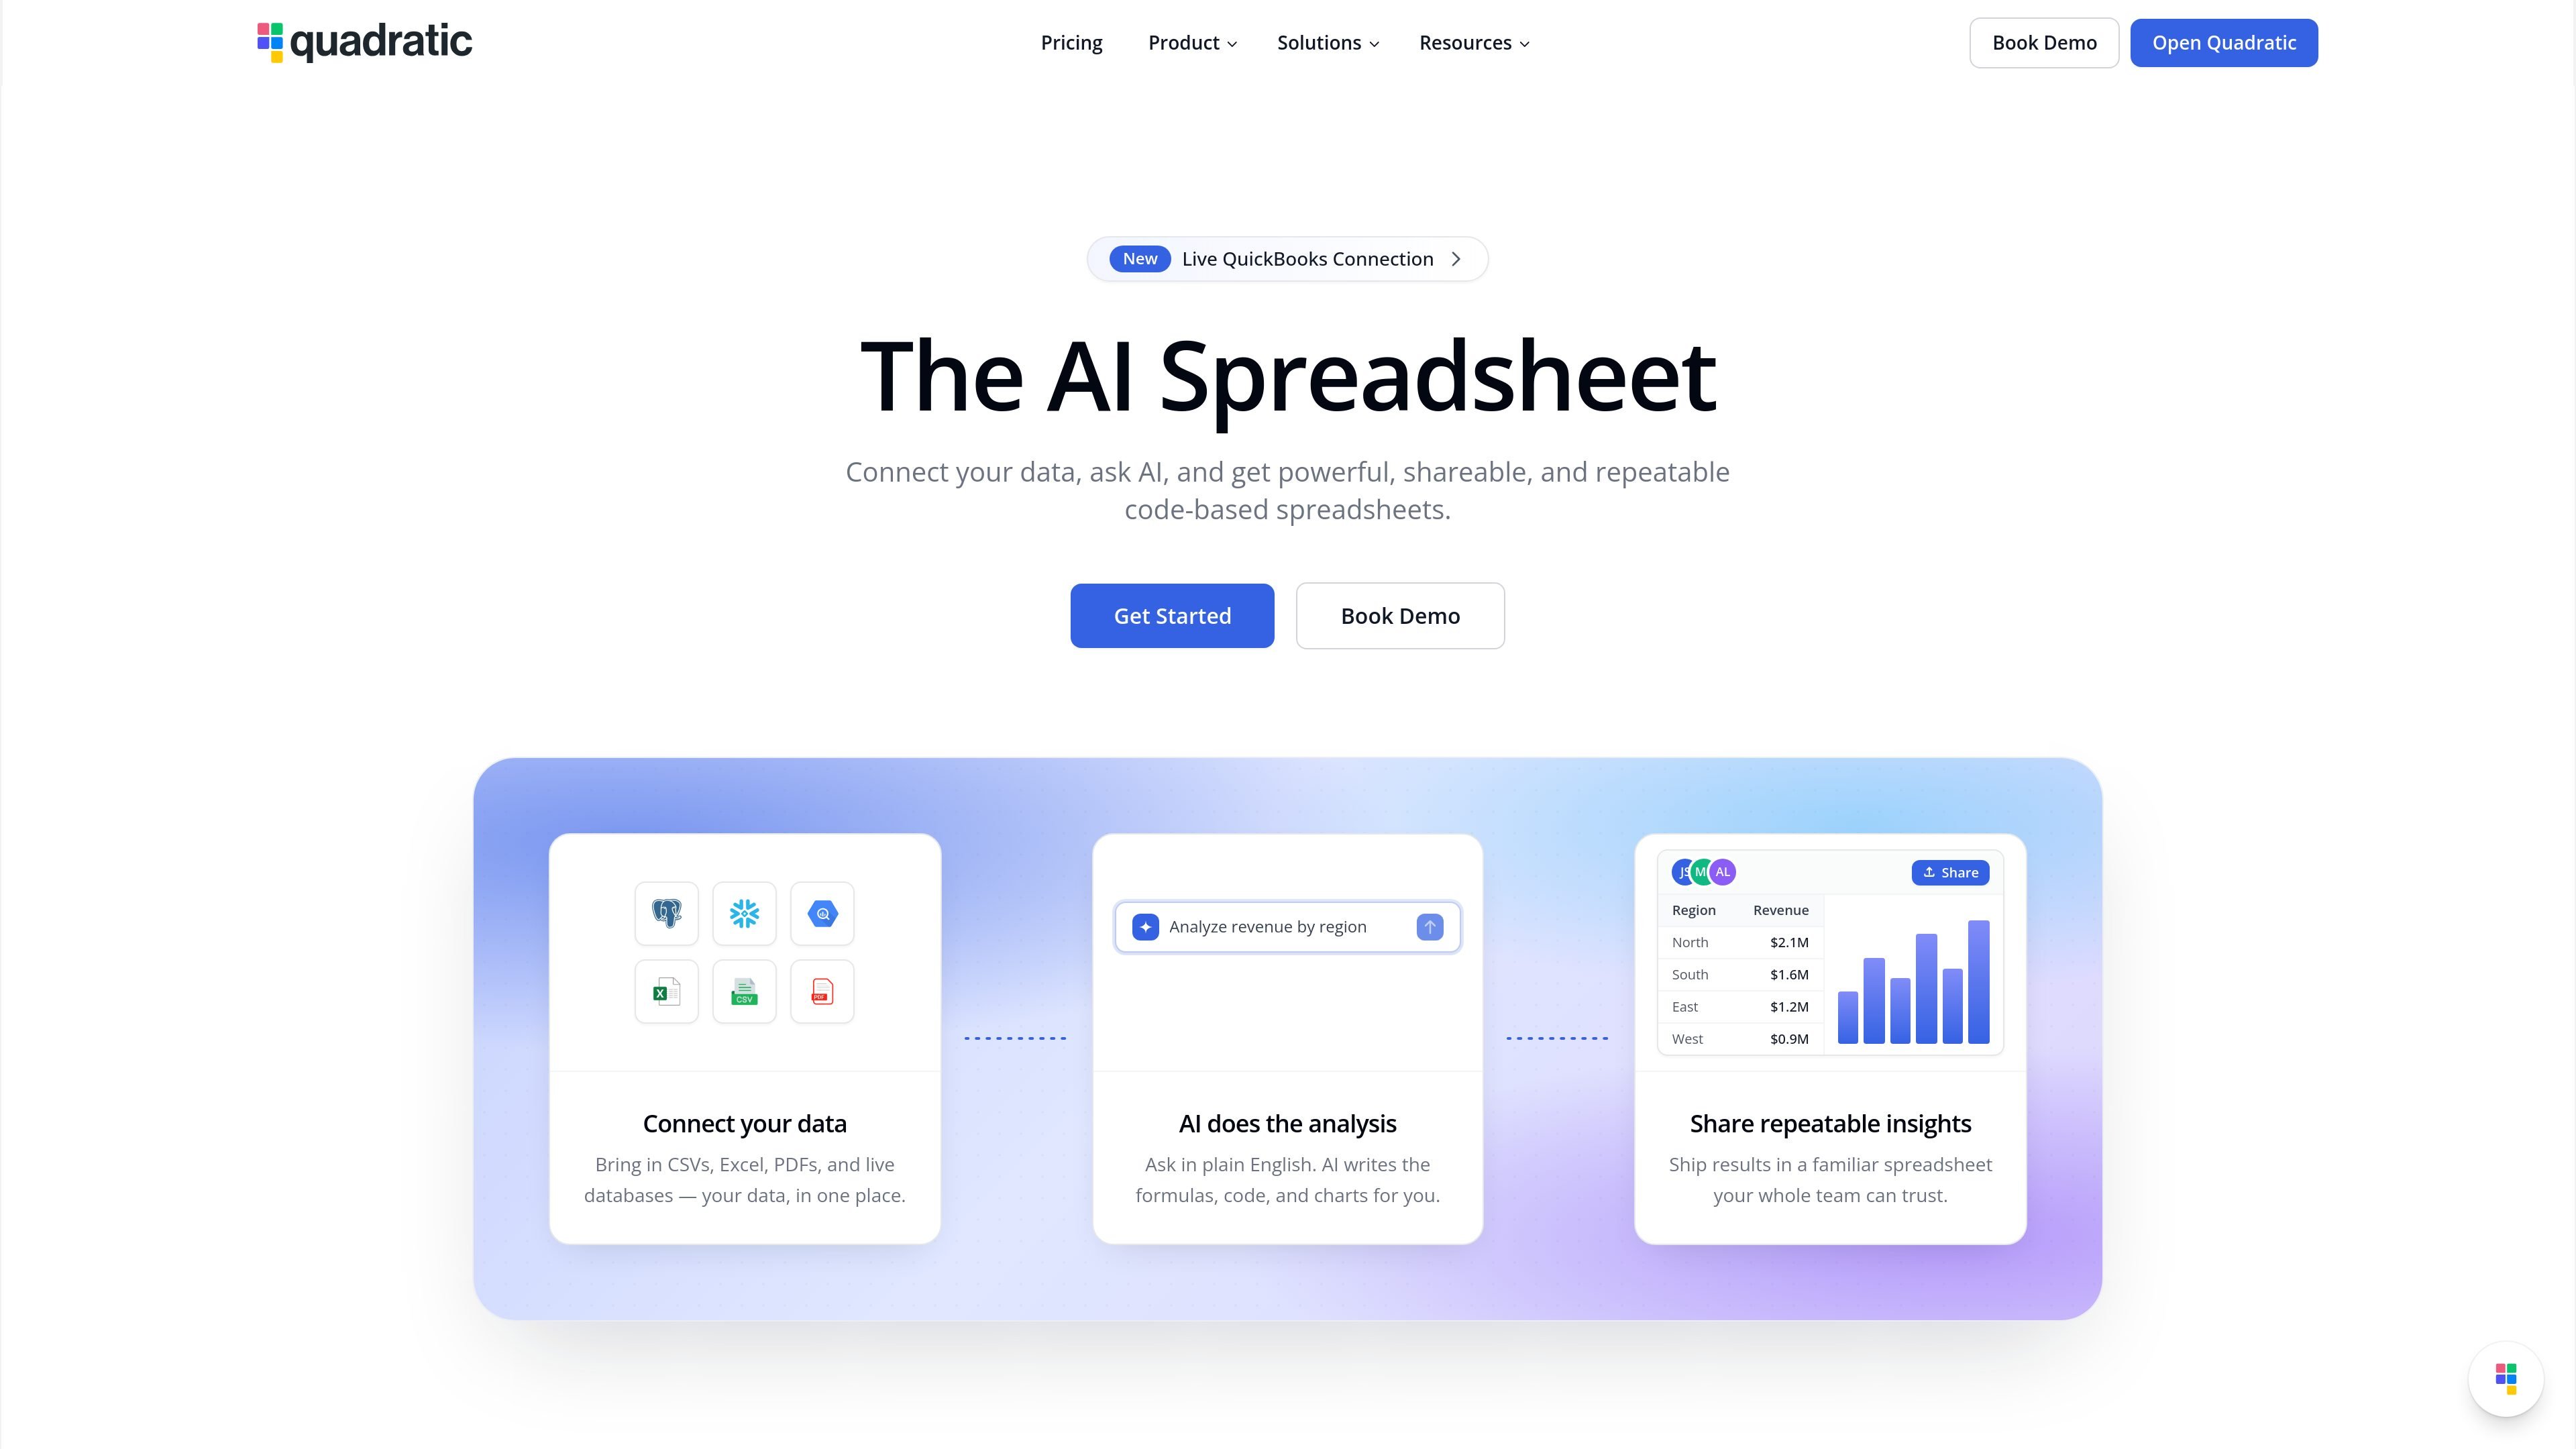
Quadratic is an AI spreadsheet designed for working with live data, formulas, and code in one place. The home page describes it as built for speed, clarity, and instant insights, with a focus on making spreadsheet analysis easier to read, verify, and update.
The product connects to databases, spreadsheets, files, and APIs so data can flow into a live sheet, then adds AI workflows through Python, SQL, formulas, MCP, and a REST API. That makes it useful for people who want spreadsheet-style analysis with programmatic control and auditable results.
Ask questions in natural language and let Quadratic generate formulas, Python, or SQL cells to work through the logic. The product emphasizes readable, auditable outputs instead of opaque answers.
Connect spreadsheets to live data sources so numbers stay current inside a single workspace. The site highlights databases, files, APIs, QuickBooks, Google Analytics, Mixpanel, and Plaid among the available connections.
Use the MCP server to let ChatGPT, Claude, Cursor, VS Code, and other compatible clients read, write, and verify spreadsheet work. Access is authenticated through OAuth and can be revoked from Quadratic settings.
Trigger AI runs, read and write cells, and orchestrate spreadsheet actions from your own code through the REST API. The API also supports atomic batches, undo and redo, and token-scoped access.
Work with collaborative sharing controls and plan-based limits that scale from personal use to teams. The pricing page distinguishes Free, Pro, Business, and Enterprise tiers with higher AI usage and team features on paid plans.
Connect a sheet to databases, spreadsheets, and business tools, then keep analysis current as source data changes.
Let an AI client read and write a spreadsheet through MCP, so users can ask questions, build charts, and update cells from chat.
Automate spreadsheet operations from code, including writing ranges, running analysis cells, creating tables, and managing sheets through the REST API.
Use Python or SQL cells to analyze tabular data, inspect outputs in place, and make changes directly in the workbook.
Import existing Excel or Google Sheets files into Quadratic and work with them through the same AI and integration tooling.
Quadratic MCP lets ChatGPT, Claude, Cursor, VS Code, and other MCP-compatible clients read and write Quadratic spreadsheets through a secure OAuth connection. It is a remote MCP server, so there is no local binary to install.
Yes. The pricing page shows Free, Pro, Business, and Enterprise options. Quadratic MCP is included with every Quadratic plan, including the free tier, while paid plans add more AI usage, sharing, and team-oriented features.
Quadratic’s API supports reading and writing cells, running Python, SQL, and formula cells, building sheets and tables, and applying formats and validations. The API is built for agent workflows and includes atomic batches, undo, and structured context endpoints.
Quadratic positions itself as an AI spreadsheet for working with connected data sources, spreadsheets, files, and APIs in one live sheet. The site also shows integrations with databases and services such as Postgres, Snowflake, BigQuery, QuickBooks, Google Analytics, Mixpanel, and Plaid.
PromptScout tracks how ChatGPT, Gemini, Google AI Overviews, and Perplexity mention your brand or competitors, with source analysis and website audits.
SaveMRR is a Stripe retention tool for SaaS teams to scan churn and MRR leaks, then automate recovery with dunning, cancel-save offers, win-back emails, and onboarding nudges.
Hype is a web tool for finding trending YouTube topics by category, time range, and scoring mode. Spot emerging ideas and review source videos.
Sleek Analytics is a privacy-friendly web analytics tool with real-time visitor tracking, Core Web Vitals, and revenue attribution.
Struere turns spreadsheet data into structured operational software with dashboards, alerts, and automations for teams replacing manual spreadsheet workflows.
ClayHog is an AI search visibility platform for tracking brand presence in ChatGPT, Gemini, Perplexity, Claude, and Google AI Overviews from one dashboard.