Loading...
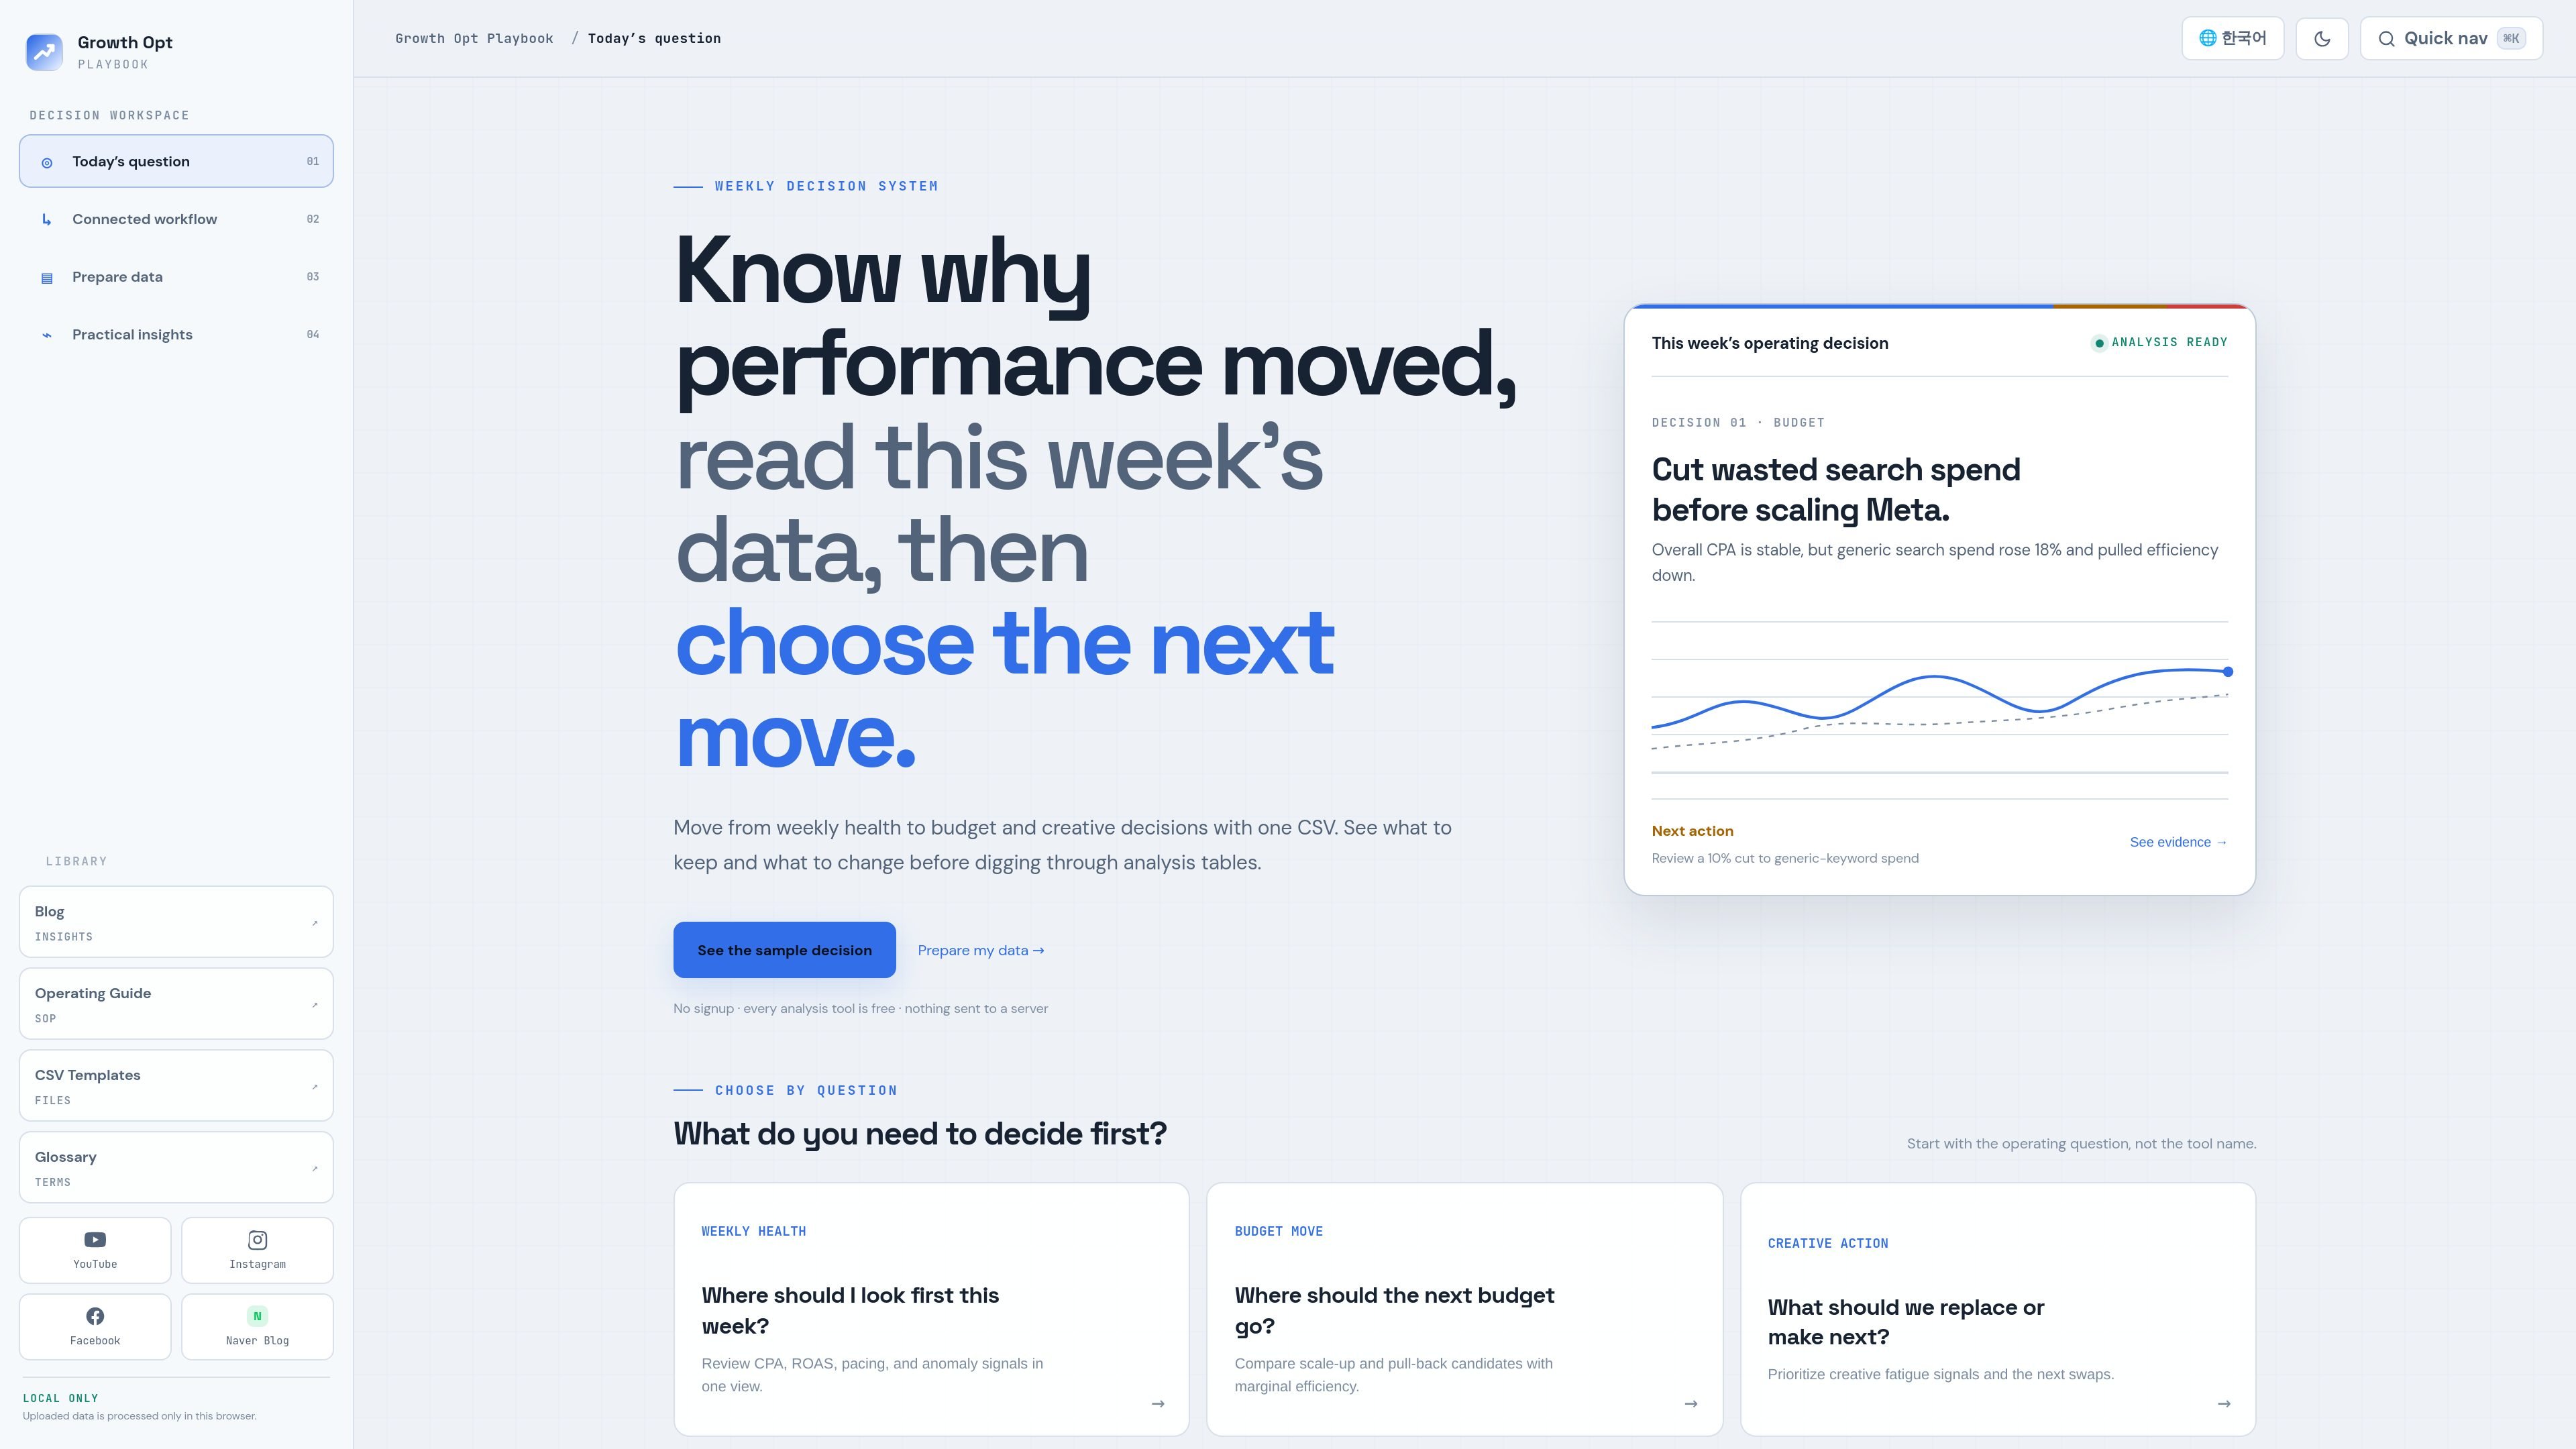
Growth Opt Playbook 是一款免費、以瀏覽器為基礎的行銷數據分析工具組,適合成效行銷人員使用。支援 CSV 上傳與 Google Sheets 工作流程,可檢視活動健康度、預算分配、創意表現與實驗結果。
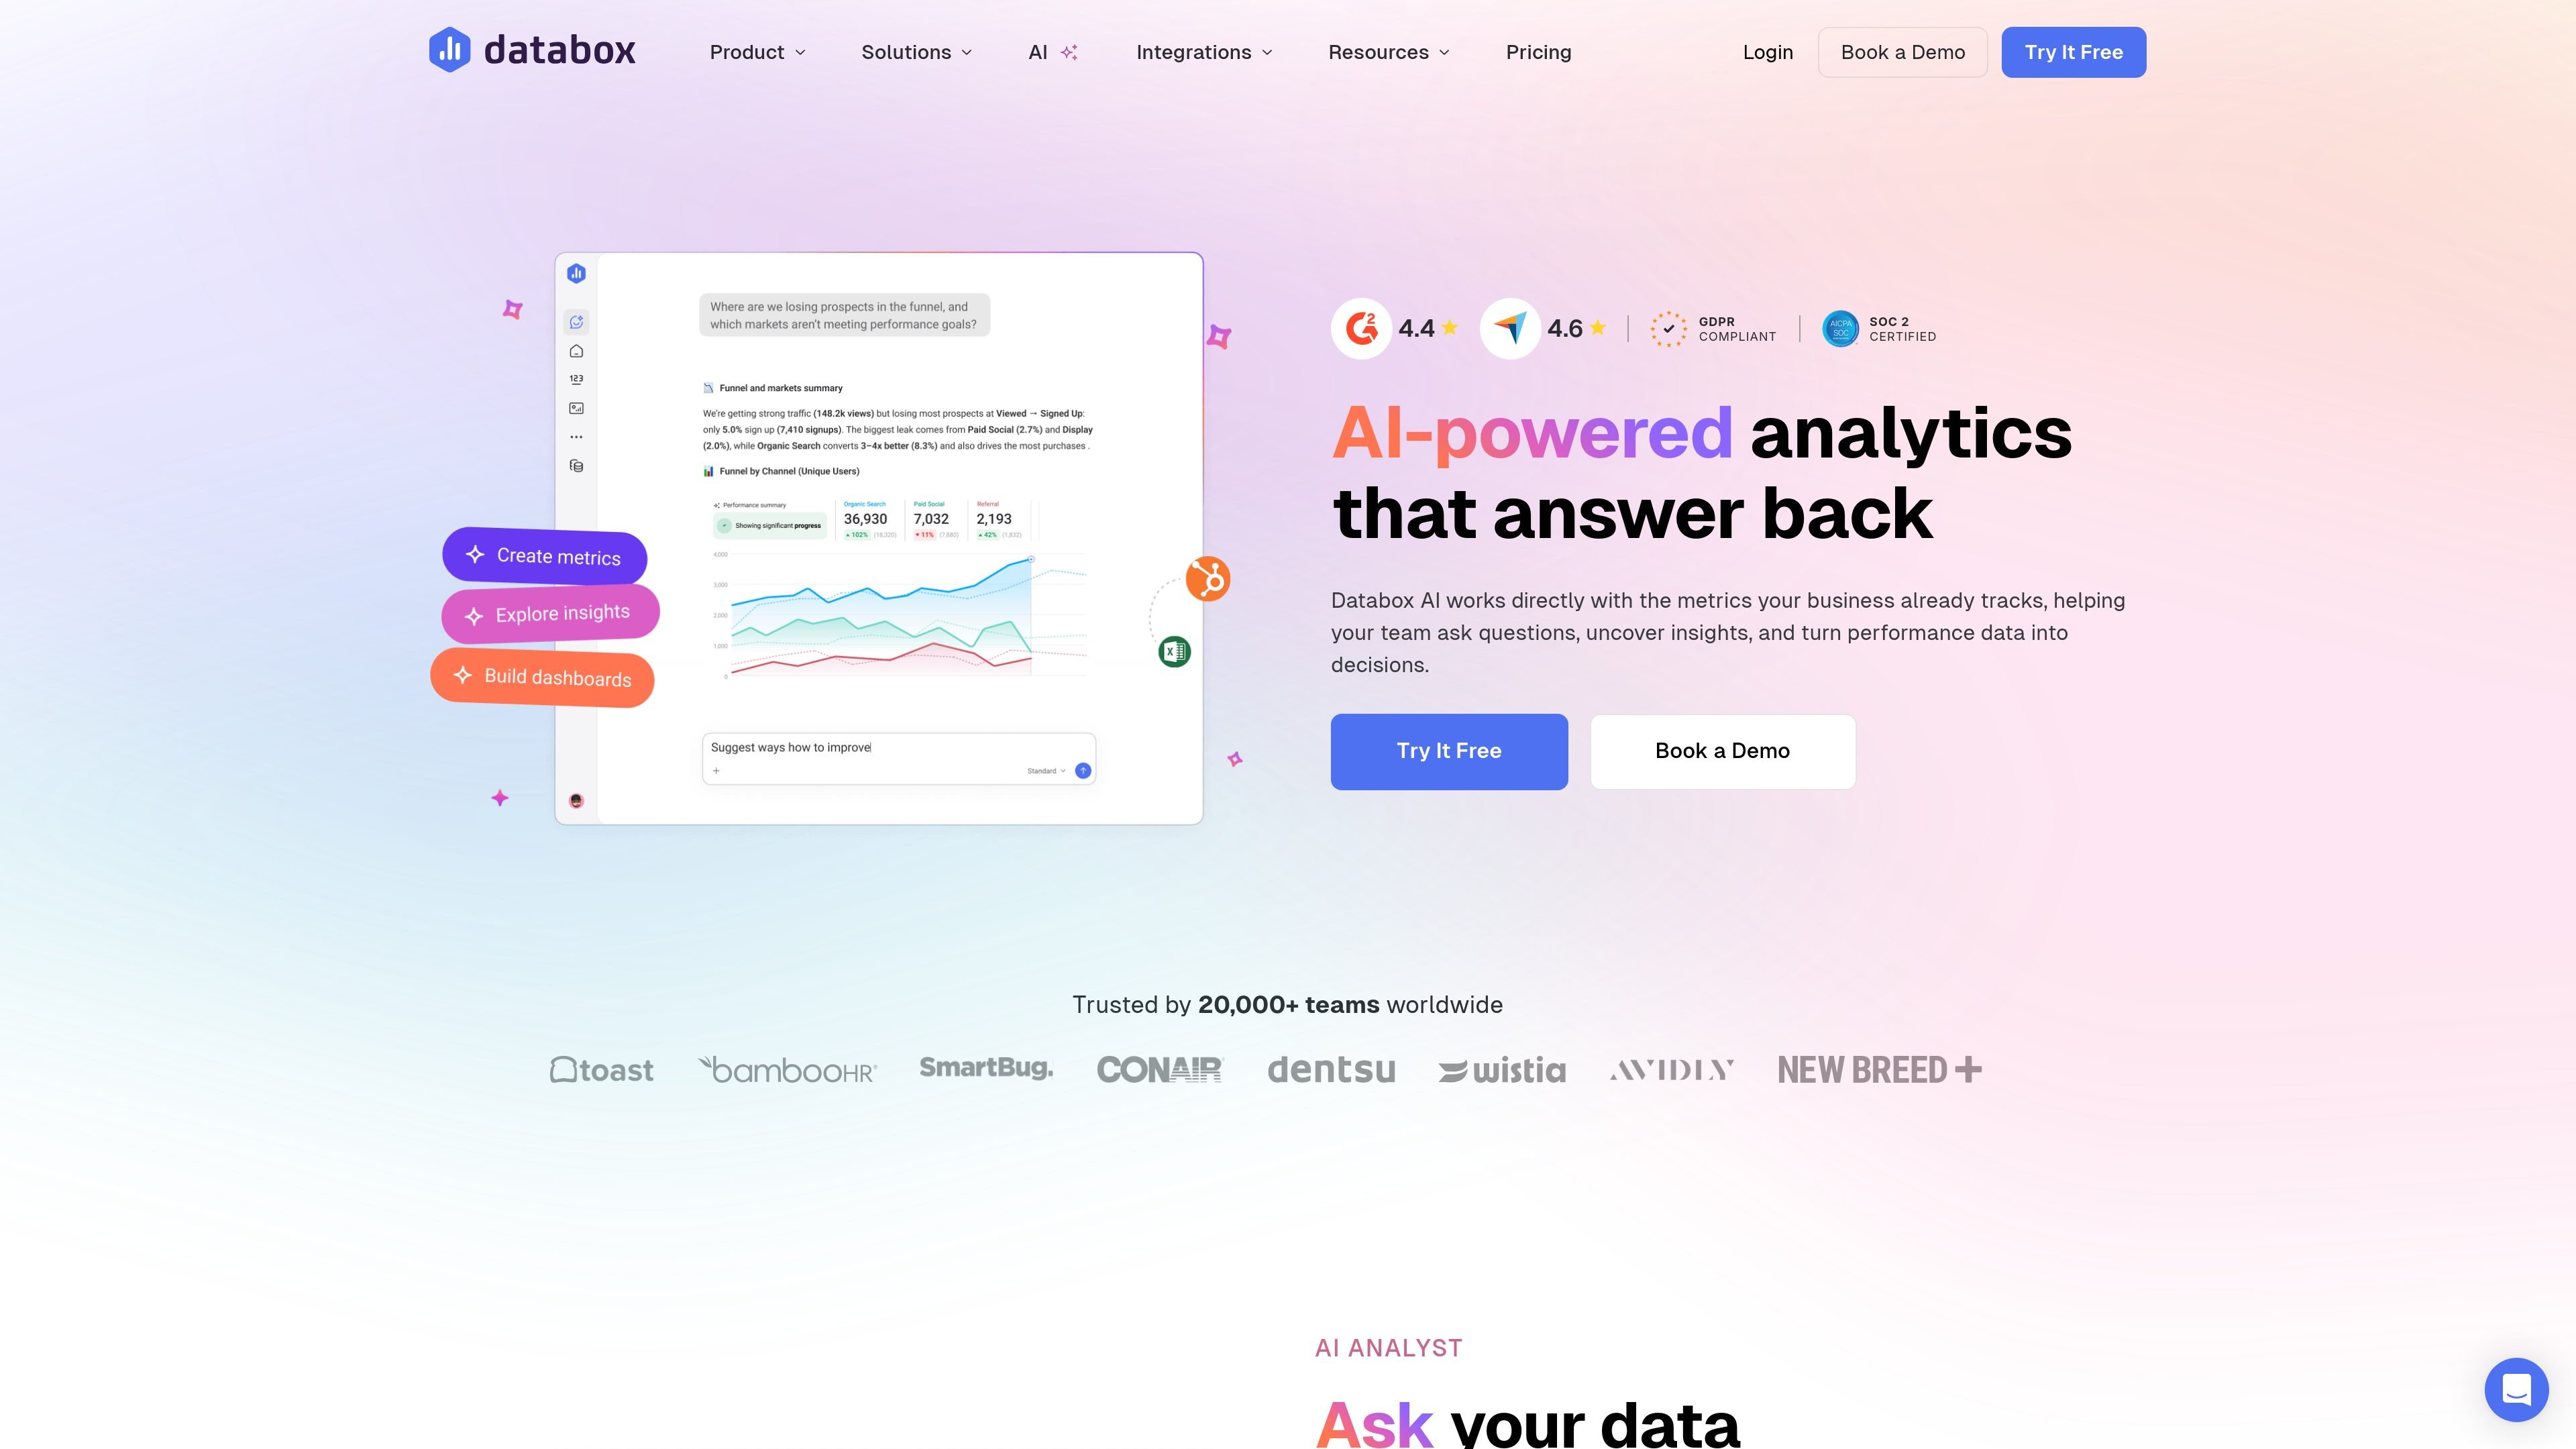
Databox AI 是一個分析層,讓你用自然語言詢問績效問題,並取得以已連接商業指標為基礎的答案;可協助團隊分析資料、摘要變化,並在外部 AI 工具中使用可信的 Databox 指標。
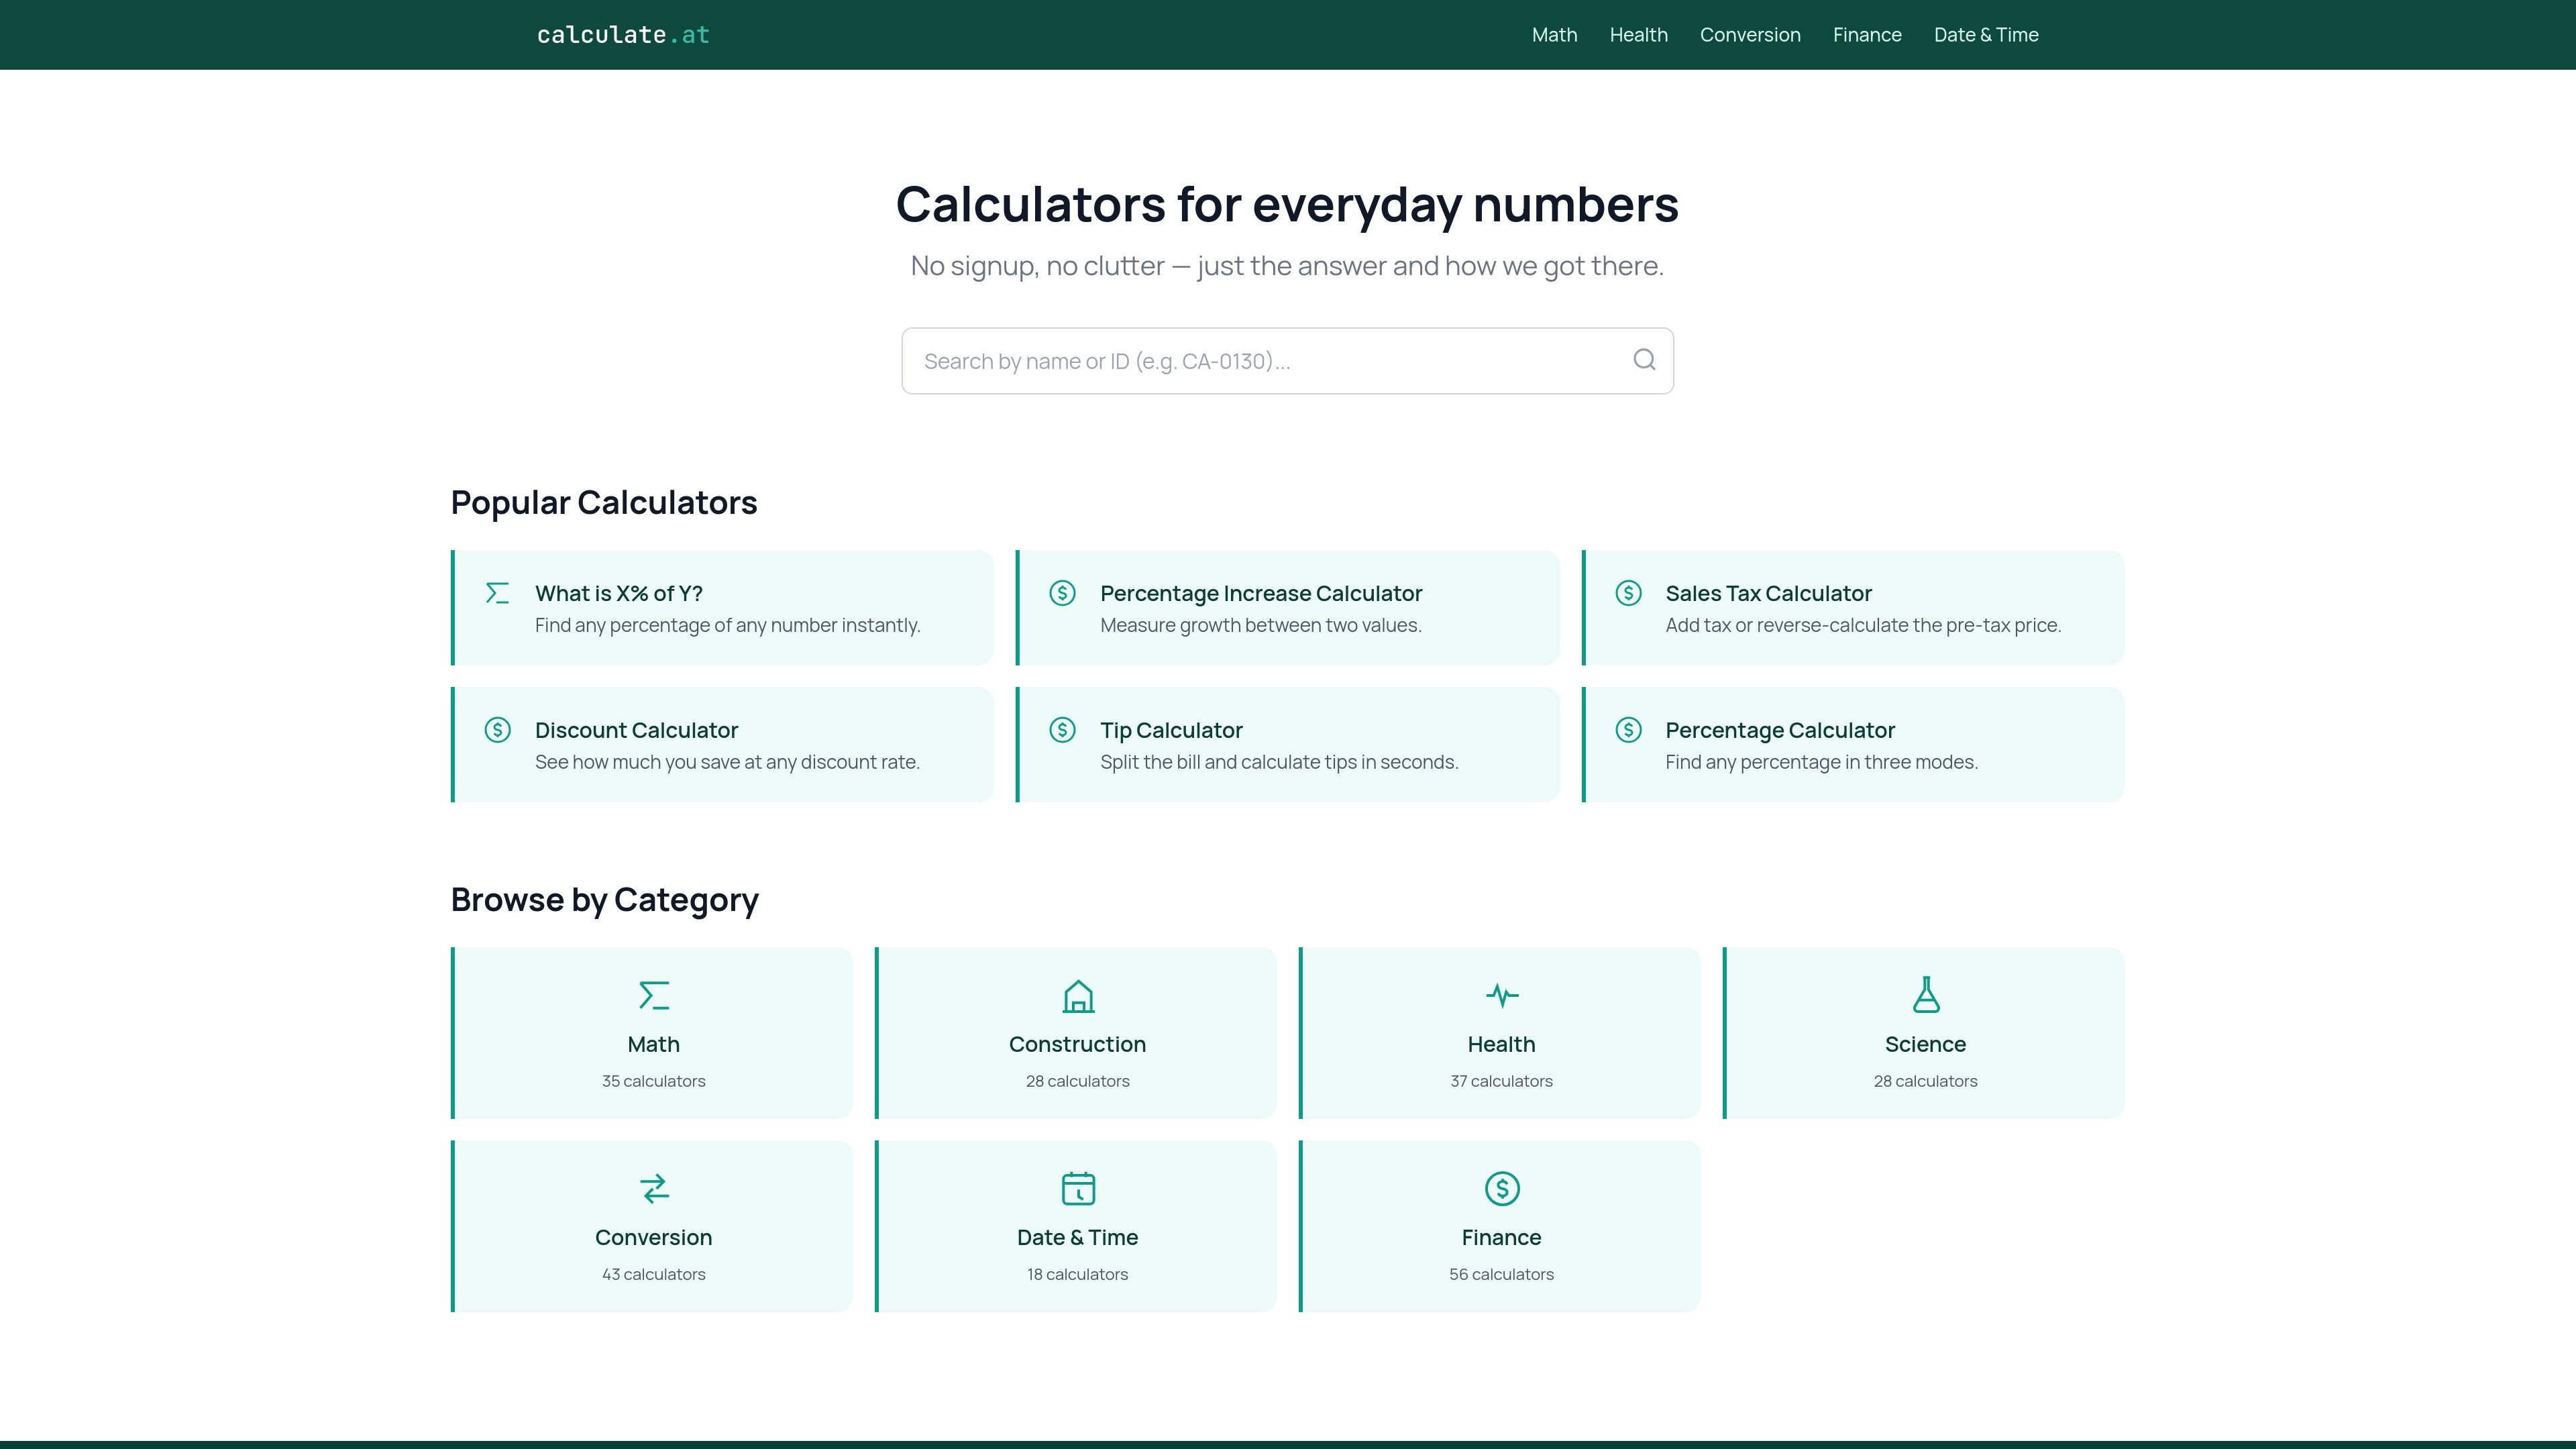
calculate.at 是一個瀏覽器版線上計算工具集,涵蓋日常數學、理財、健康、換算與日期時間計算;免註冊,並提供公式與範例結果。
Basedash developer platform 透過 API 與 MCP server 提供 Basedash 的 AI 分析師、洞察、自動化、儀表板與圖表功能,適用於面向客戶的分析與內部資料流程。

SIP Calculator 2026 是一款線上共同基金與財富規劃工具,可估算 SIP 成長、目標儲蓄、階梯式投資、稅務調整與通膨影響,並提供圖表與匯出功能。
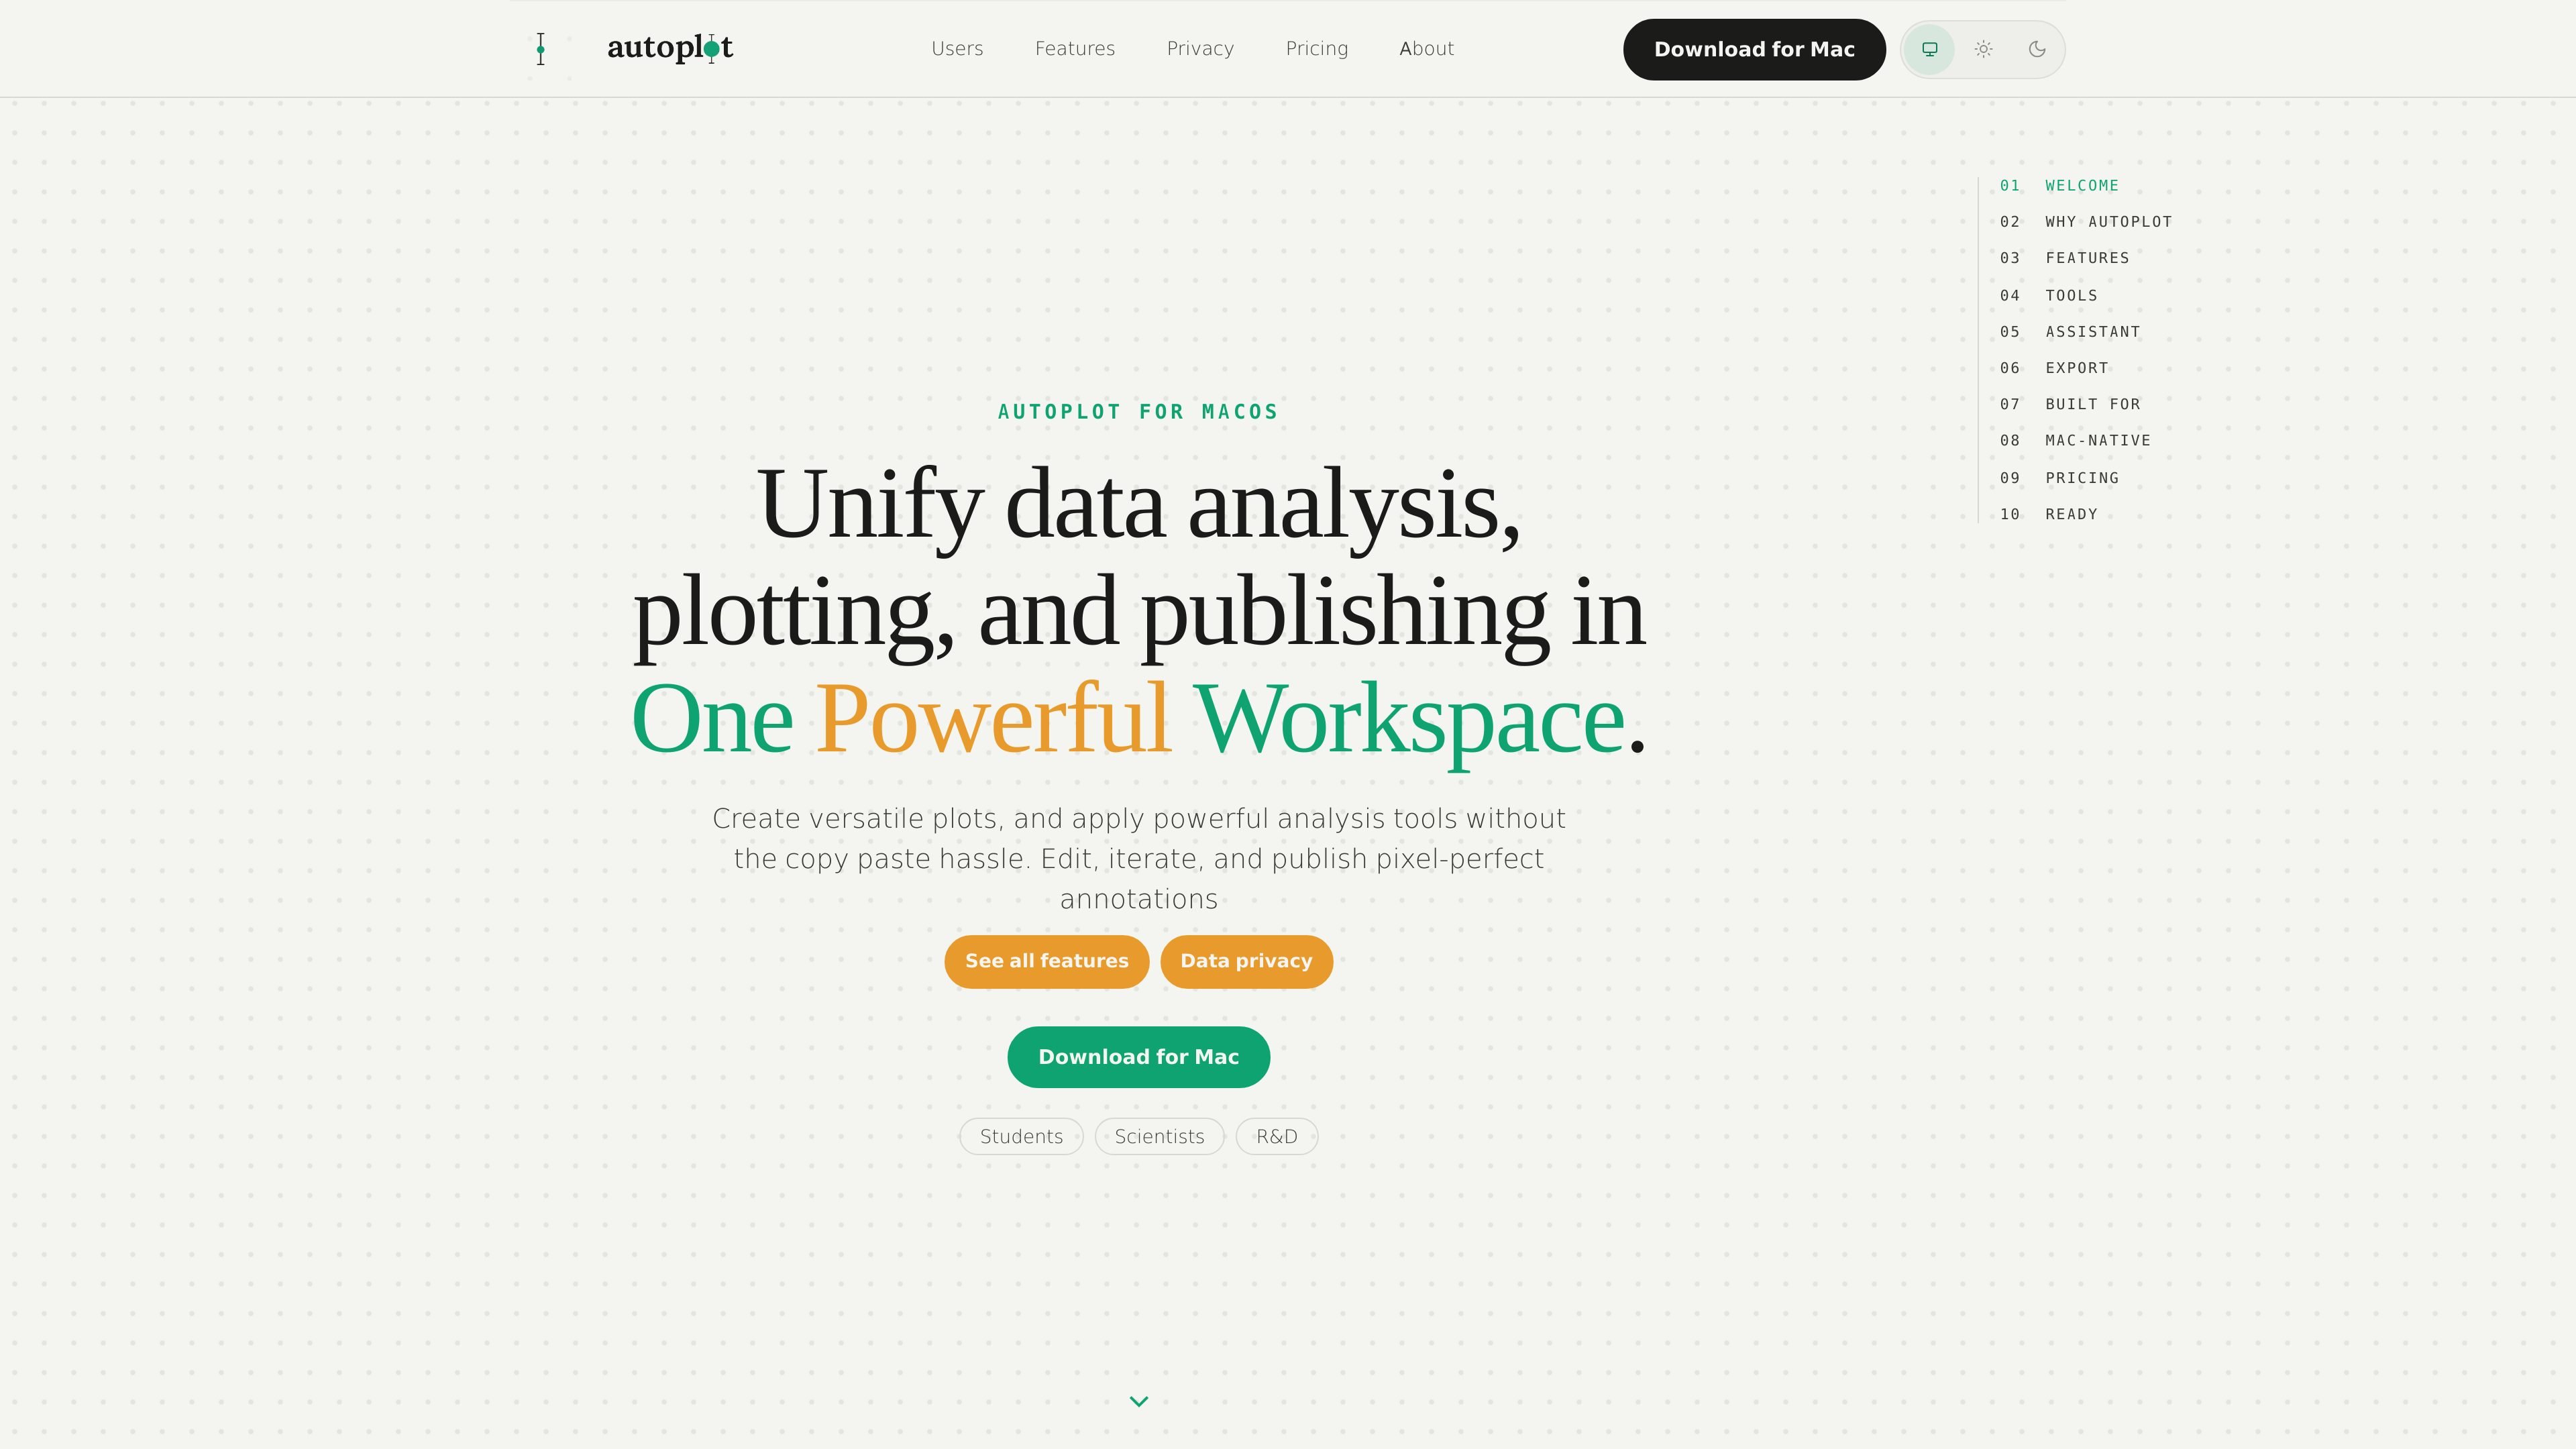
Autoplot 是原生 Mac 工作區,可匯入表格型科學資料、建立圖表與分析輸出,並匯出可直接用於出版的圖形,適合重視本機優先流程並可選用雲端 AI 輔助的學生、科學家與 R&D 團隊。
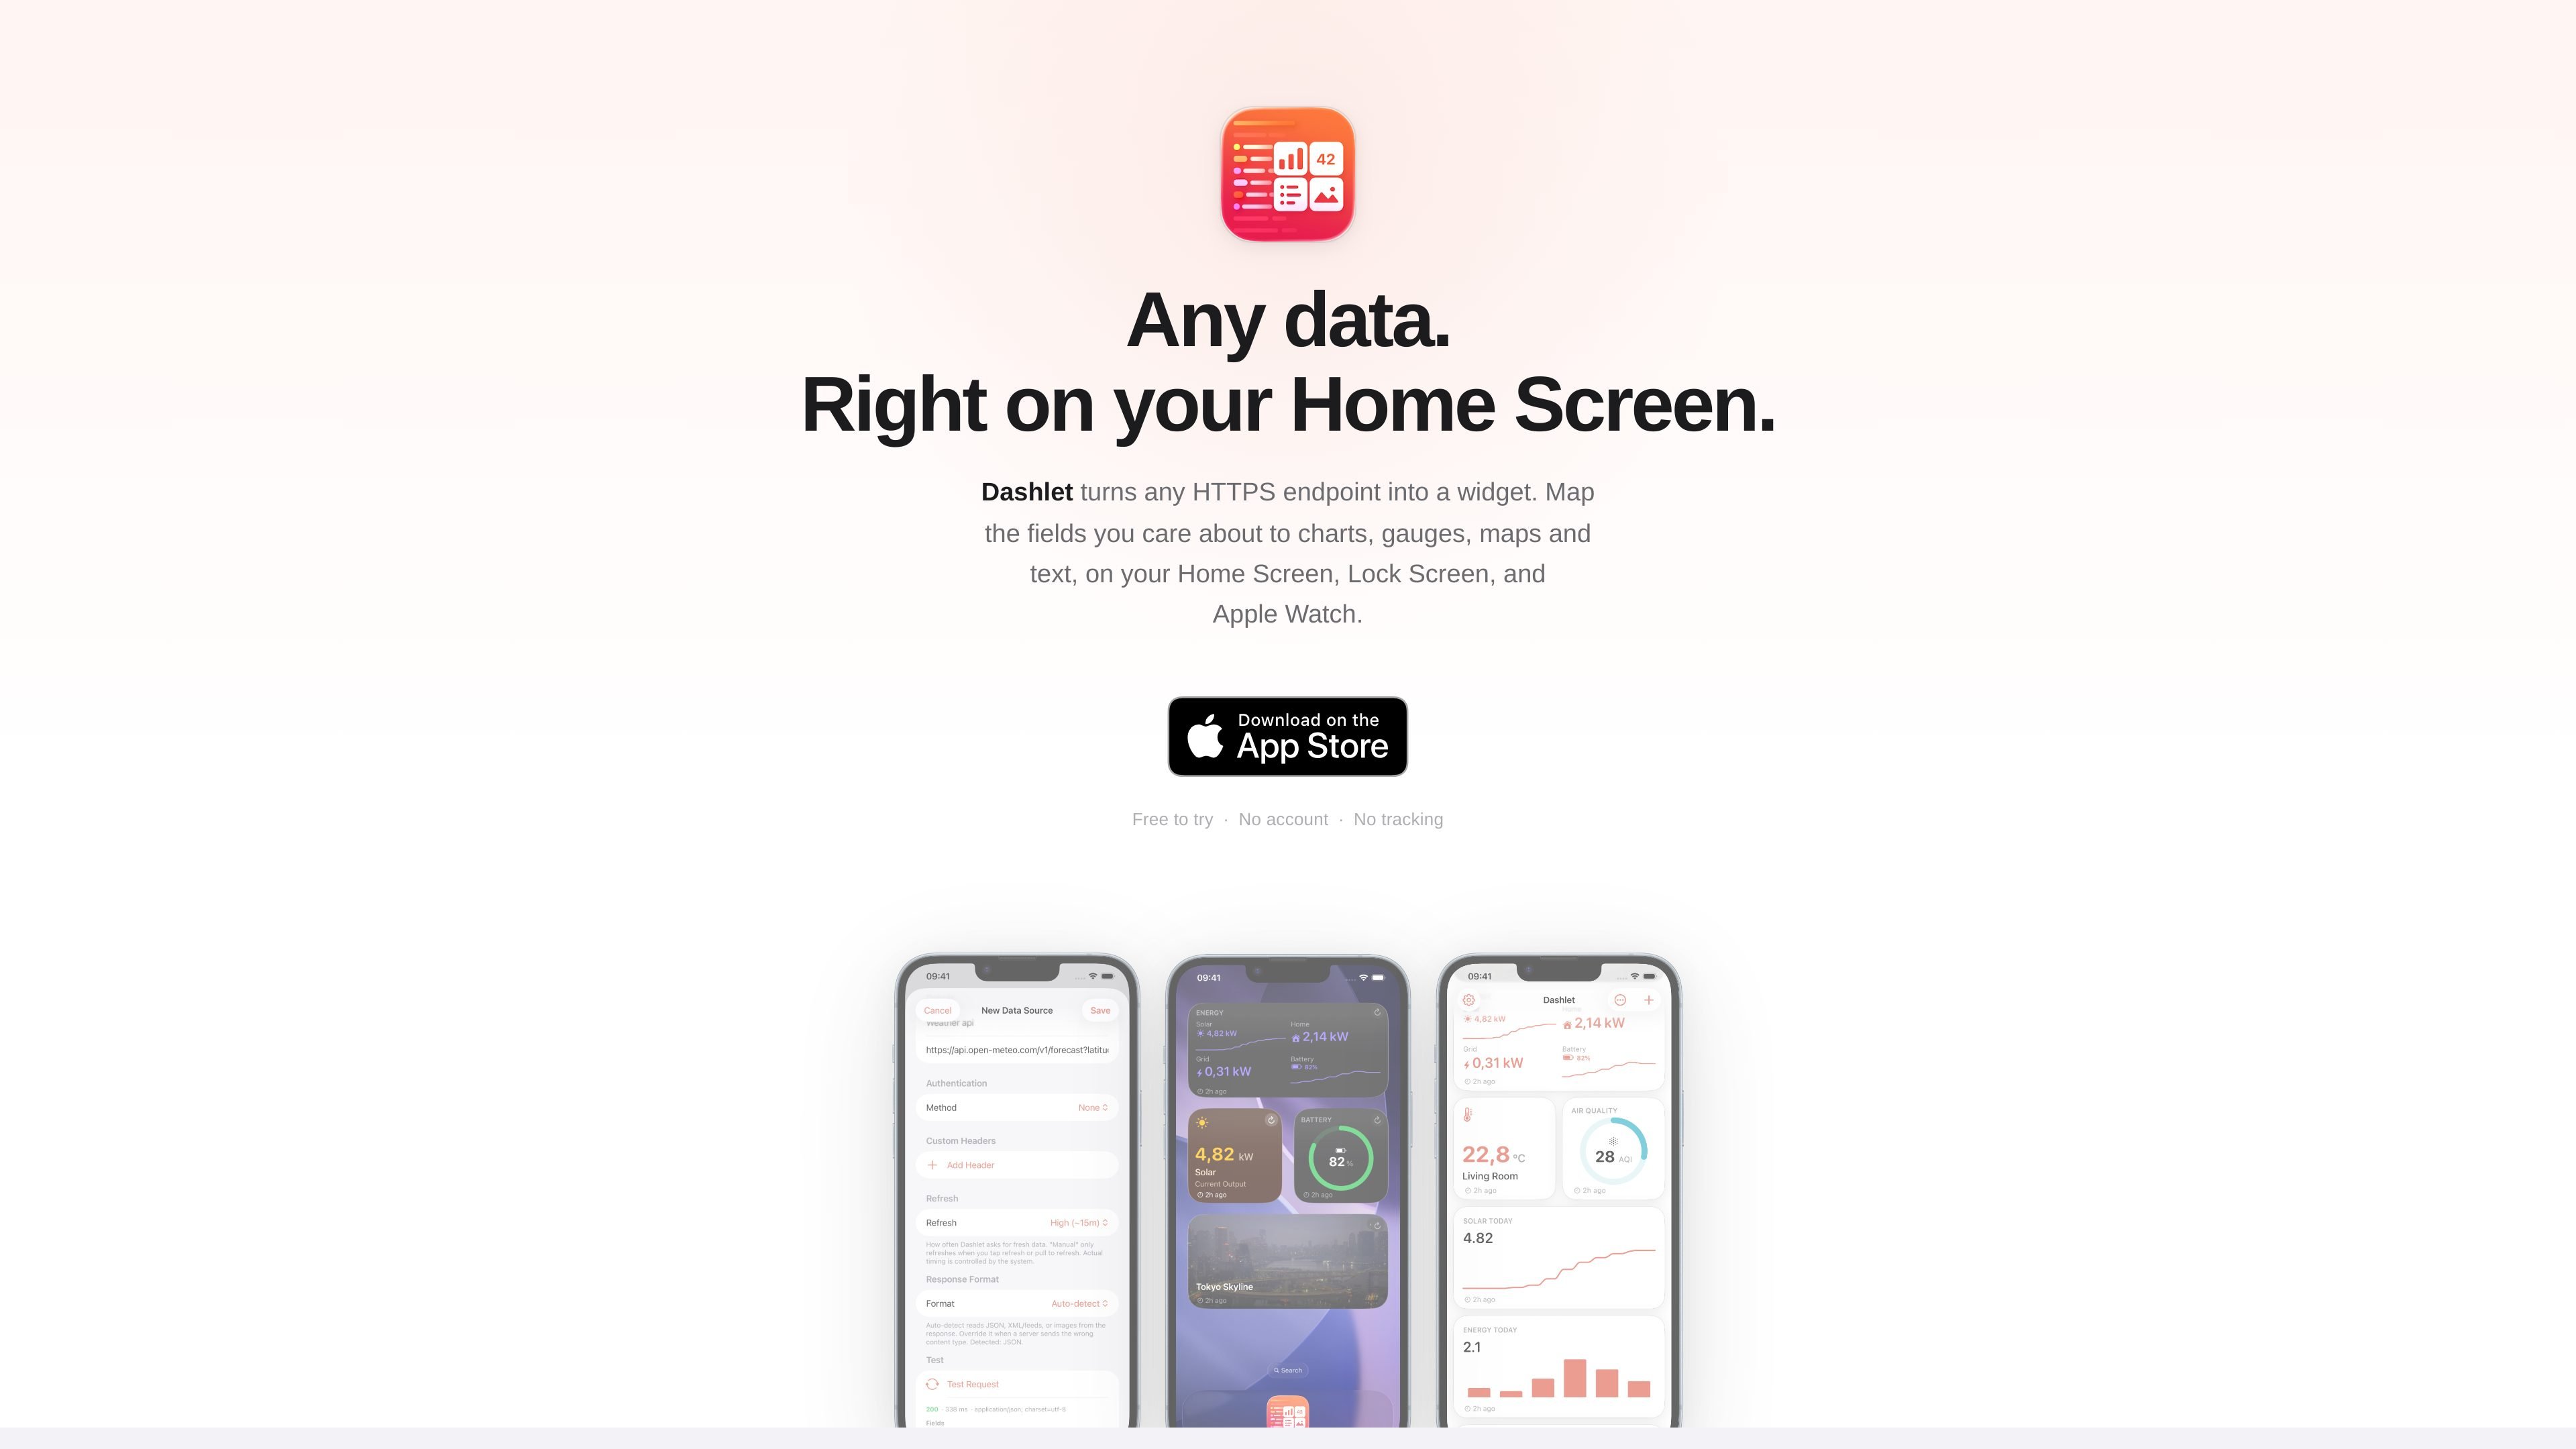
Dashlet 是一款 iOS 應用,可將 HTTPS 端點資料轉成主畫面、鎖定畫面、StandBy 與 Apple Watch 小工具,支援驗證來源、即時欄位對應與圖表、儀表、圖片、地圖等版型。
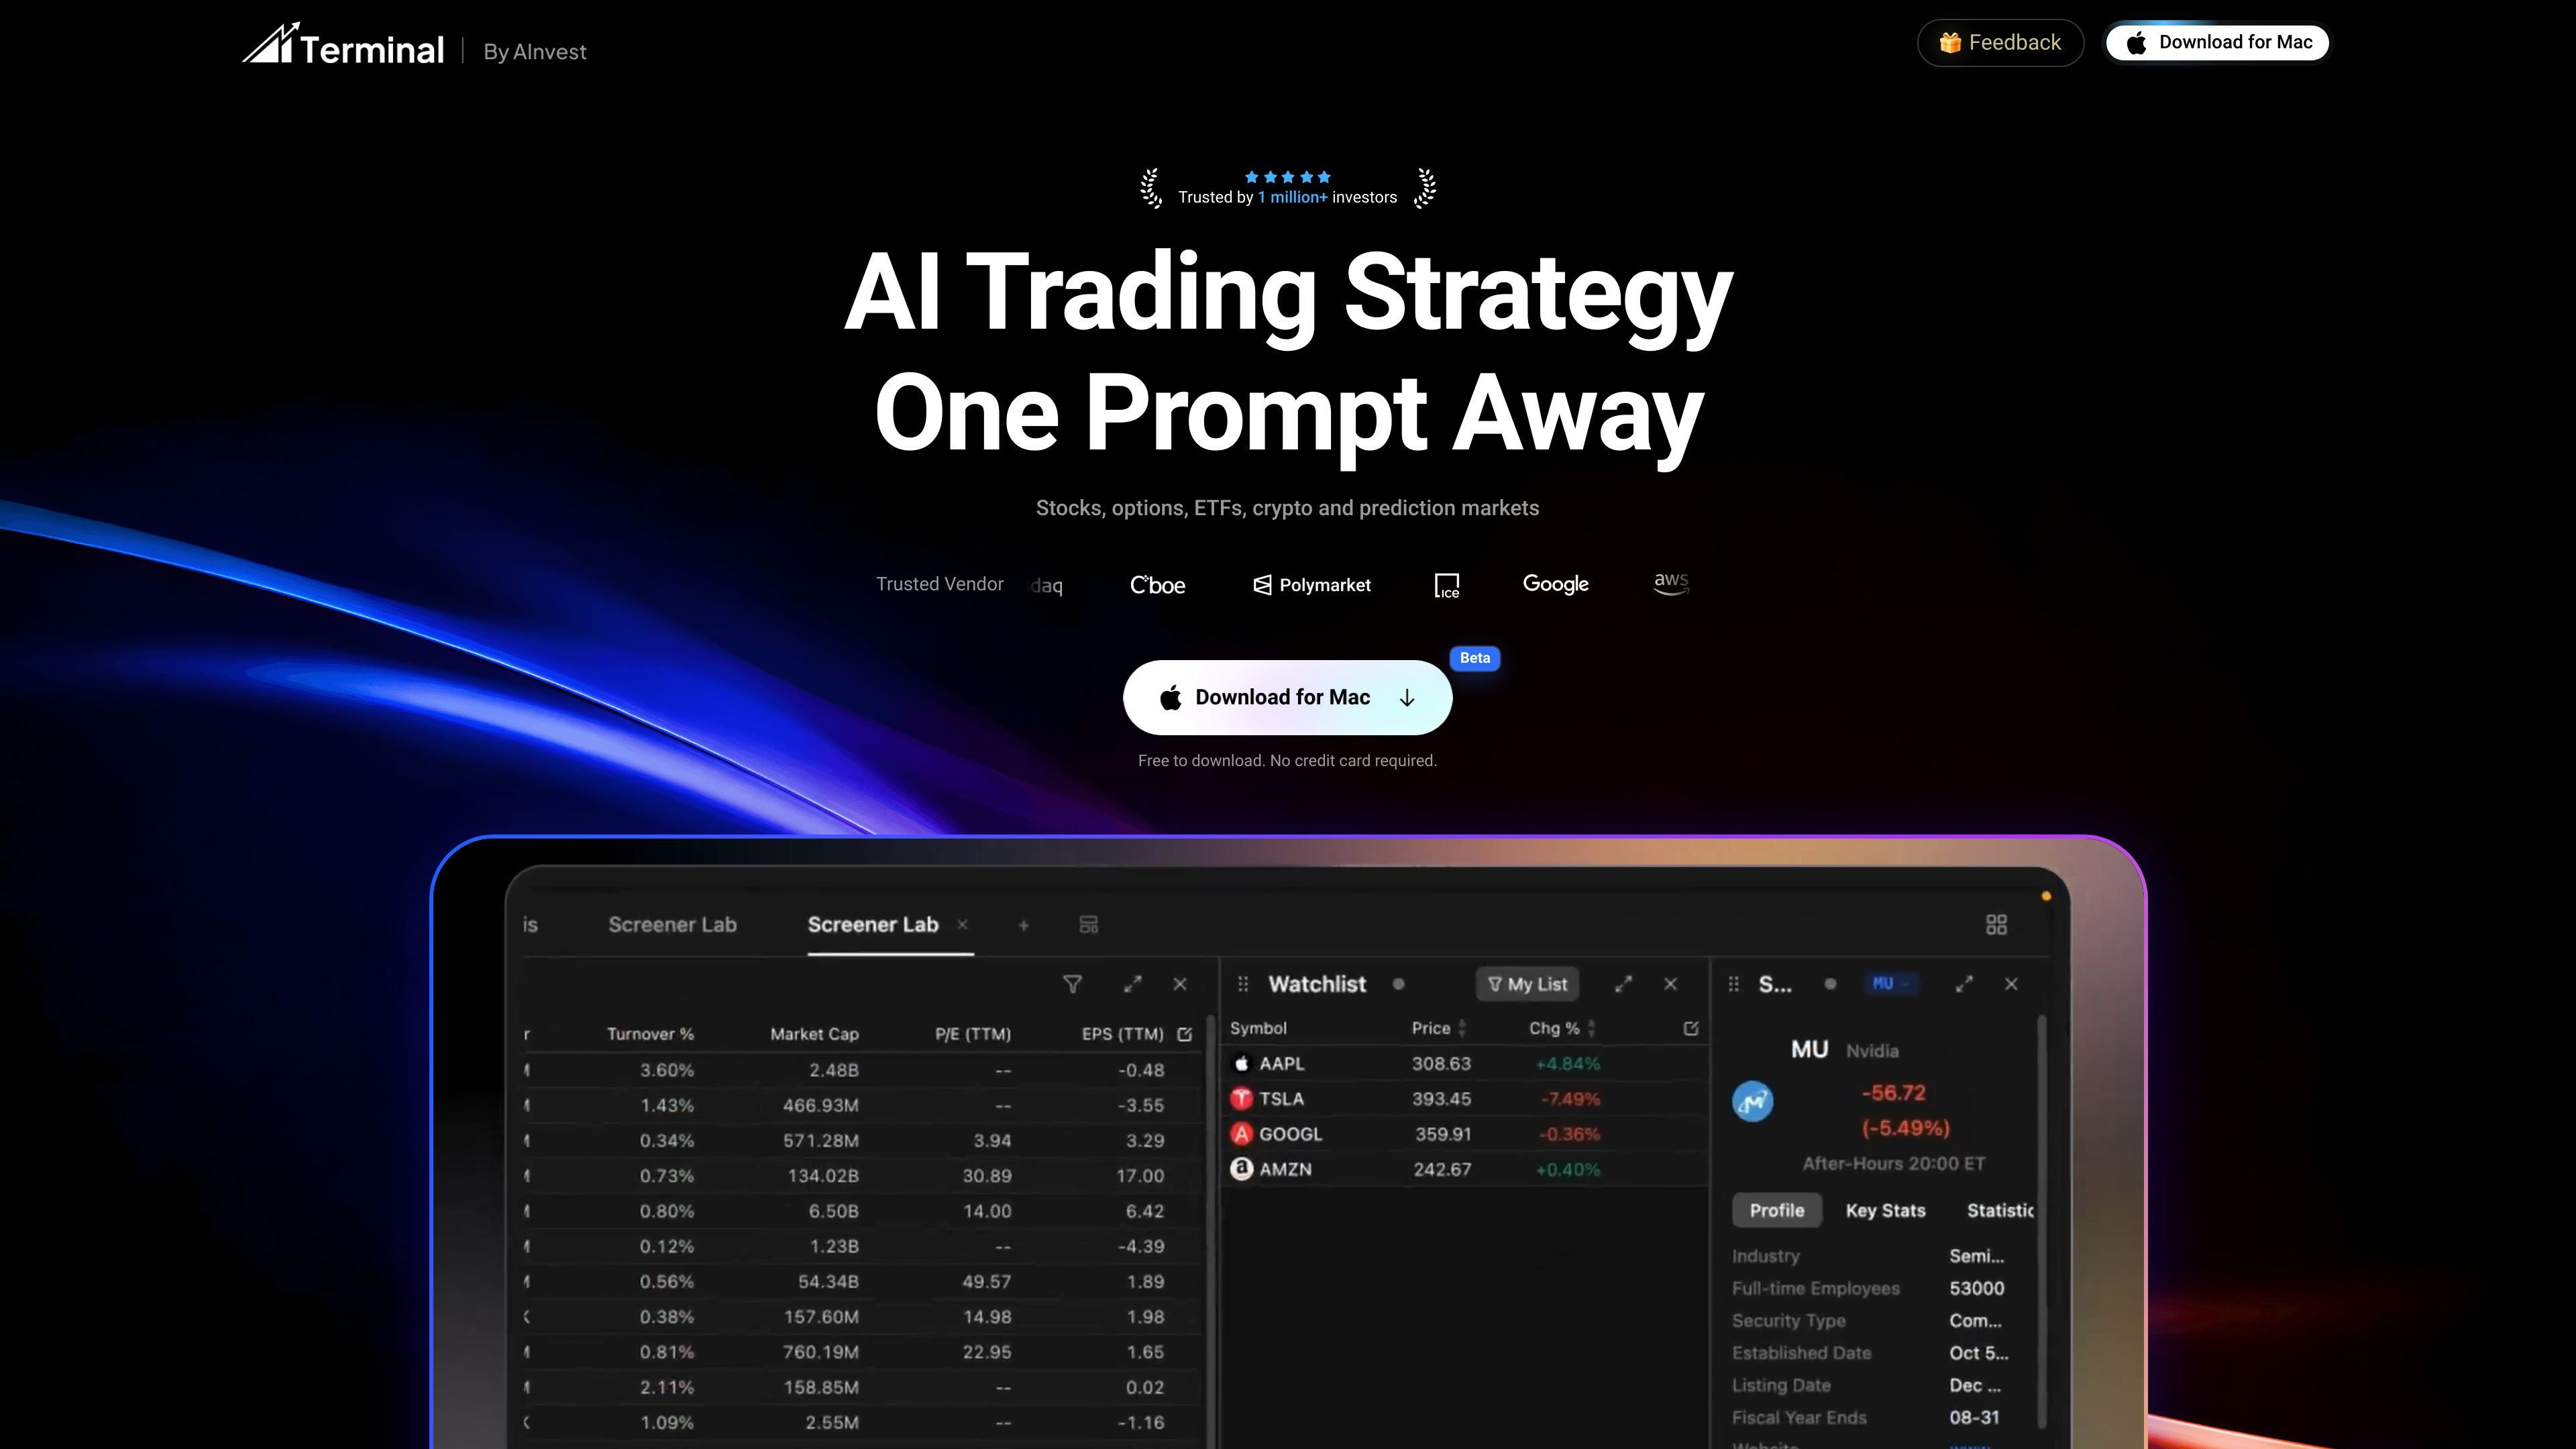
AInvest Terminal 是一款 macOS 桌面應用程式,提供 AI 輔助的股票與市場分析,整合聊天研究、篩選器、圖表、新聞與市場數據,適合想要引導式工作流程的投資人。
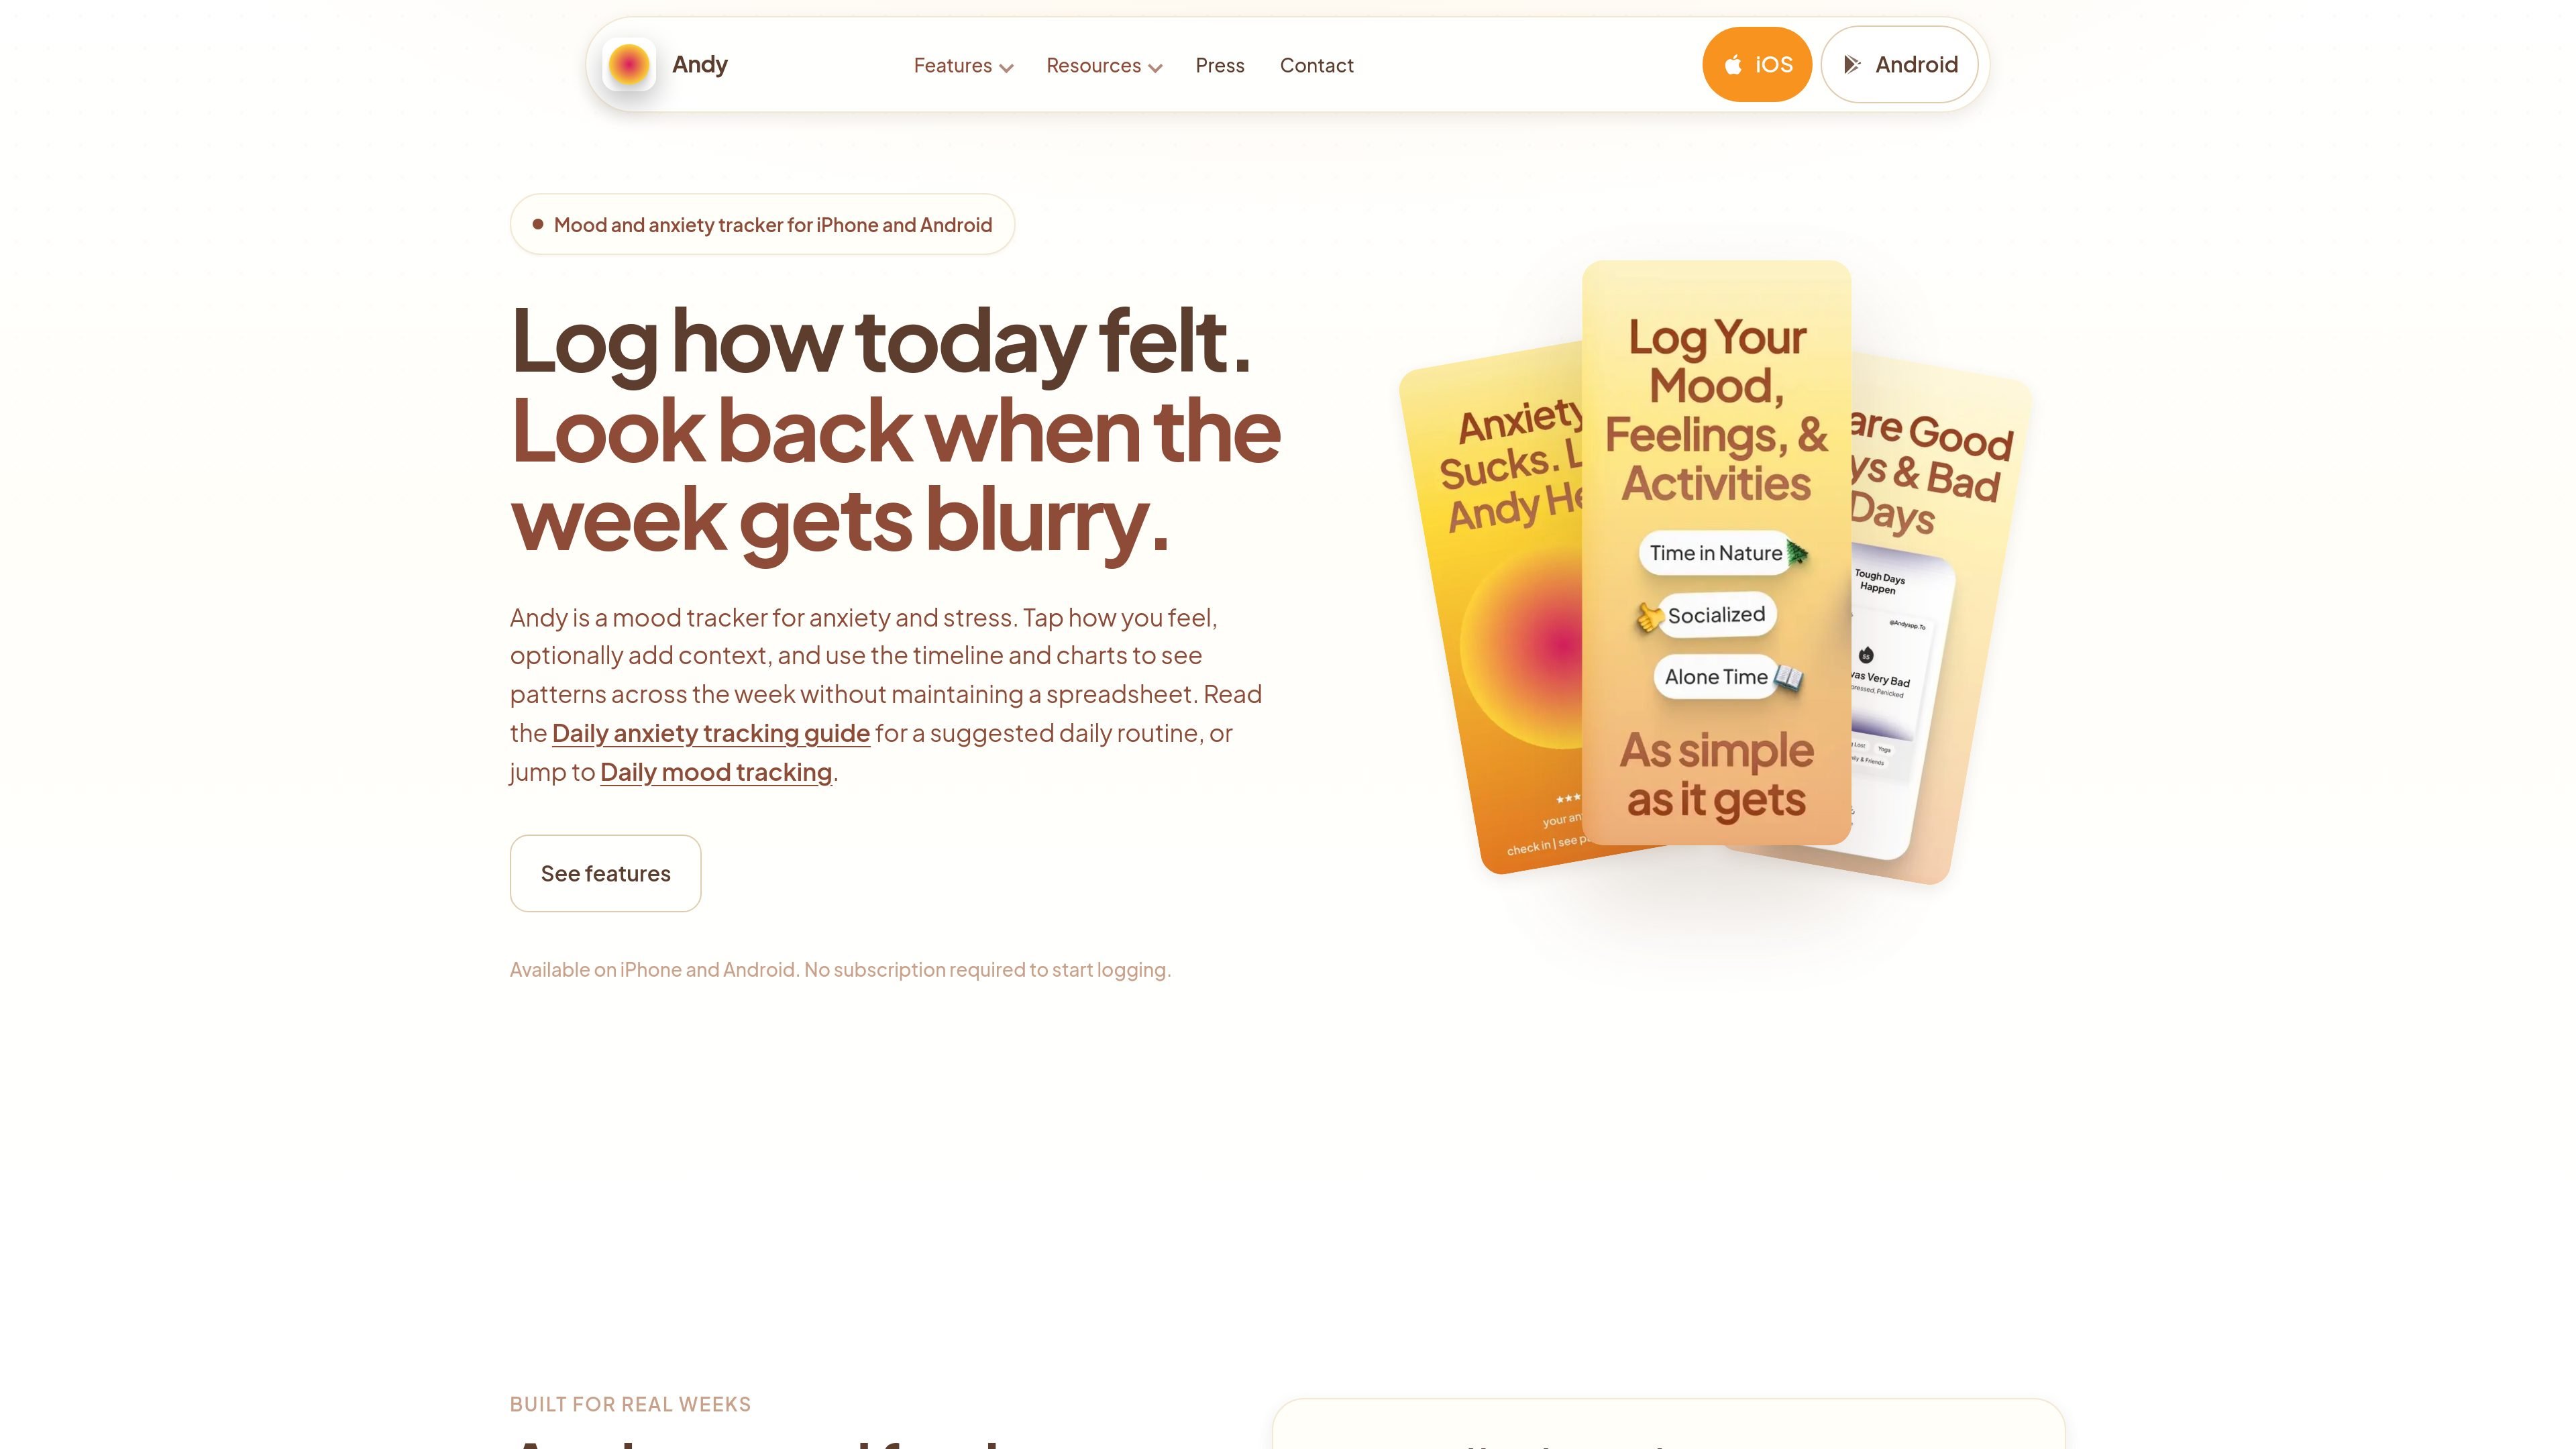
Andy 是一款適用於 iPhone 與 Android 的情緒與焦慮追蹤器,支援快速每日打卡、可選備註與標籤、時間軸回顧、圖表、提醒、連續紀錄、分享卡與資料匯出。
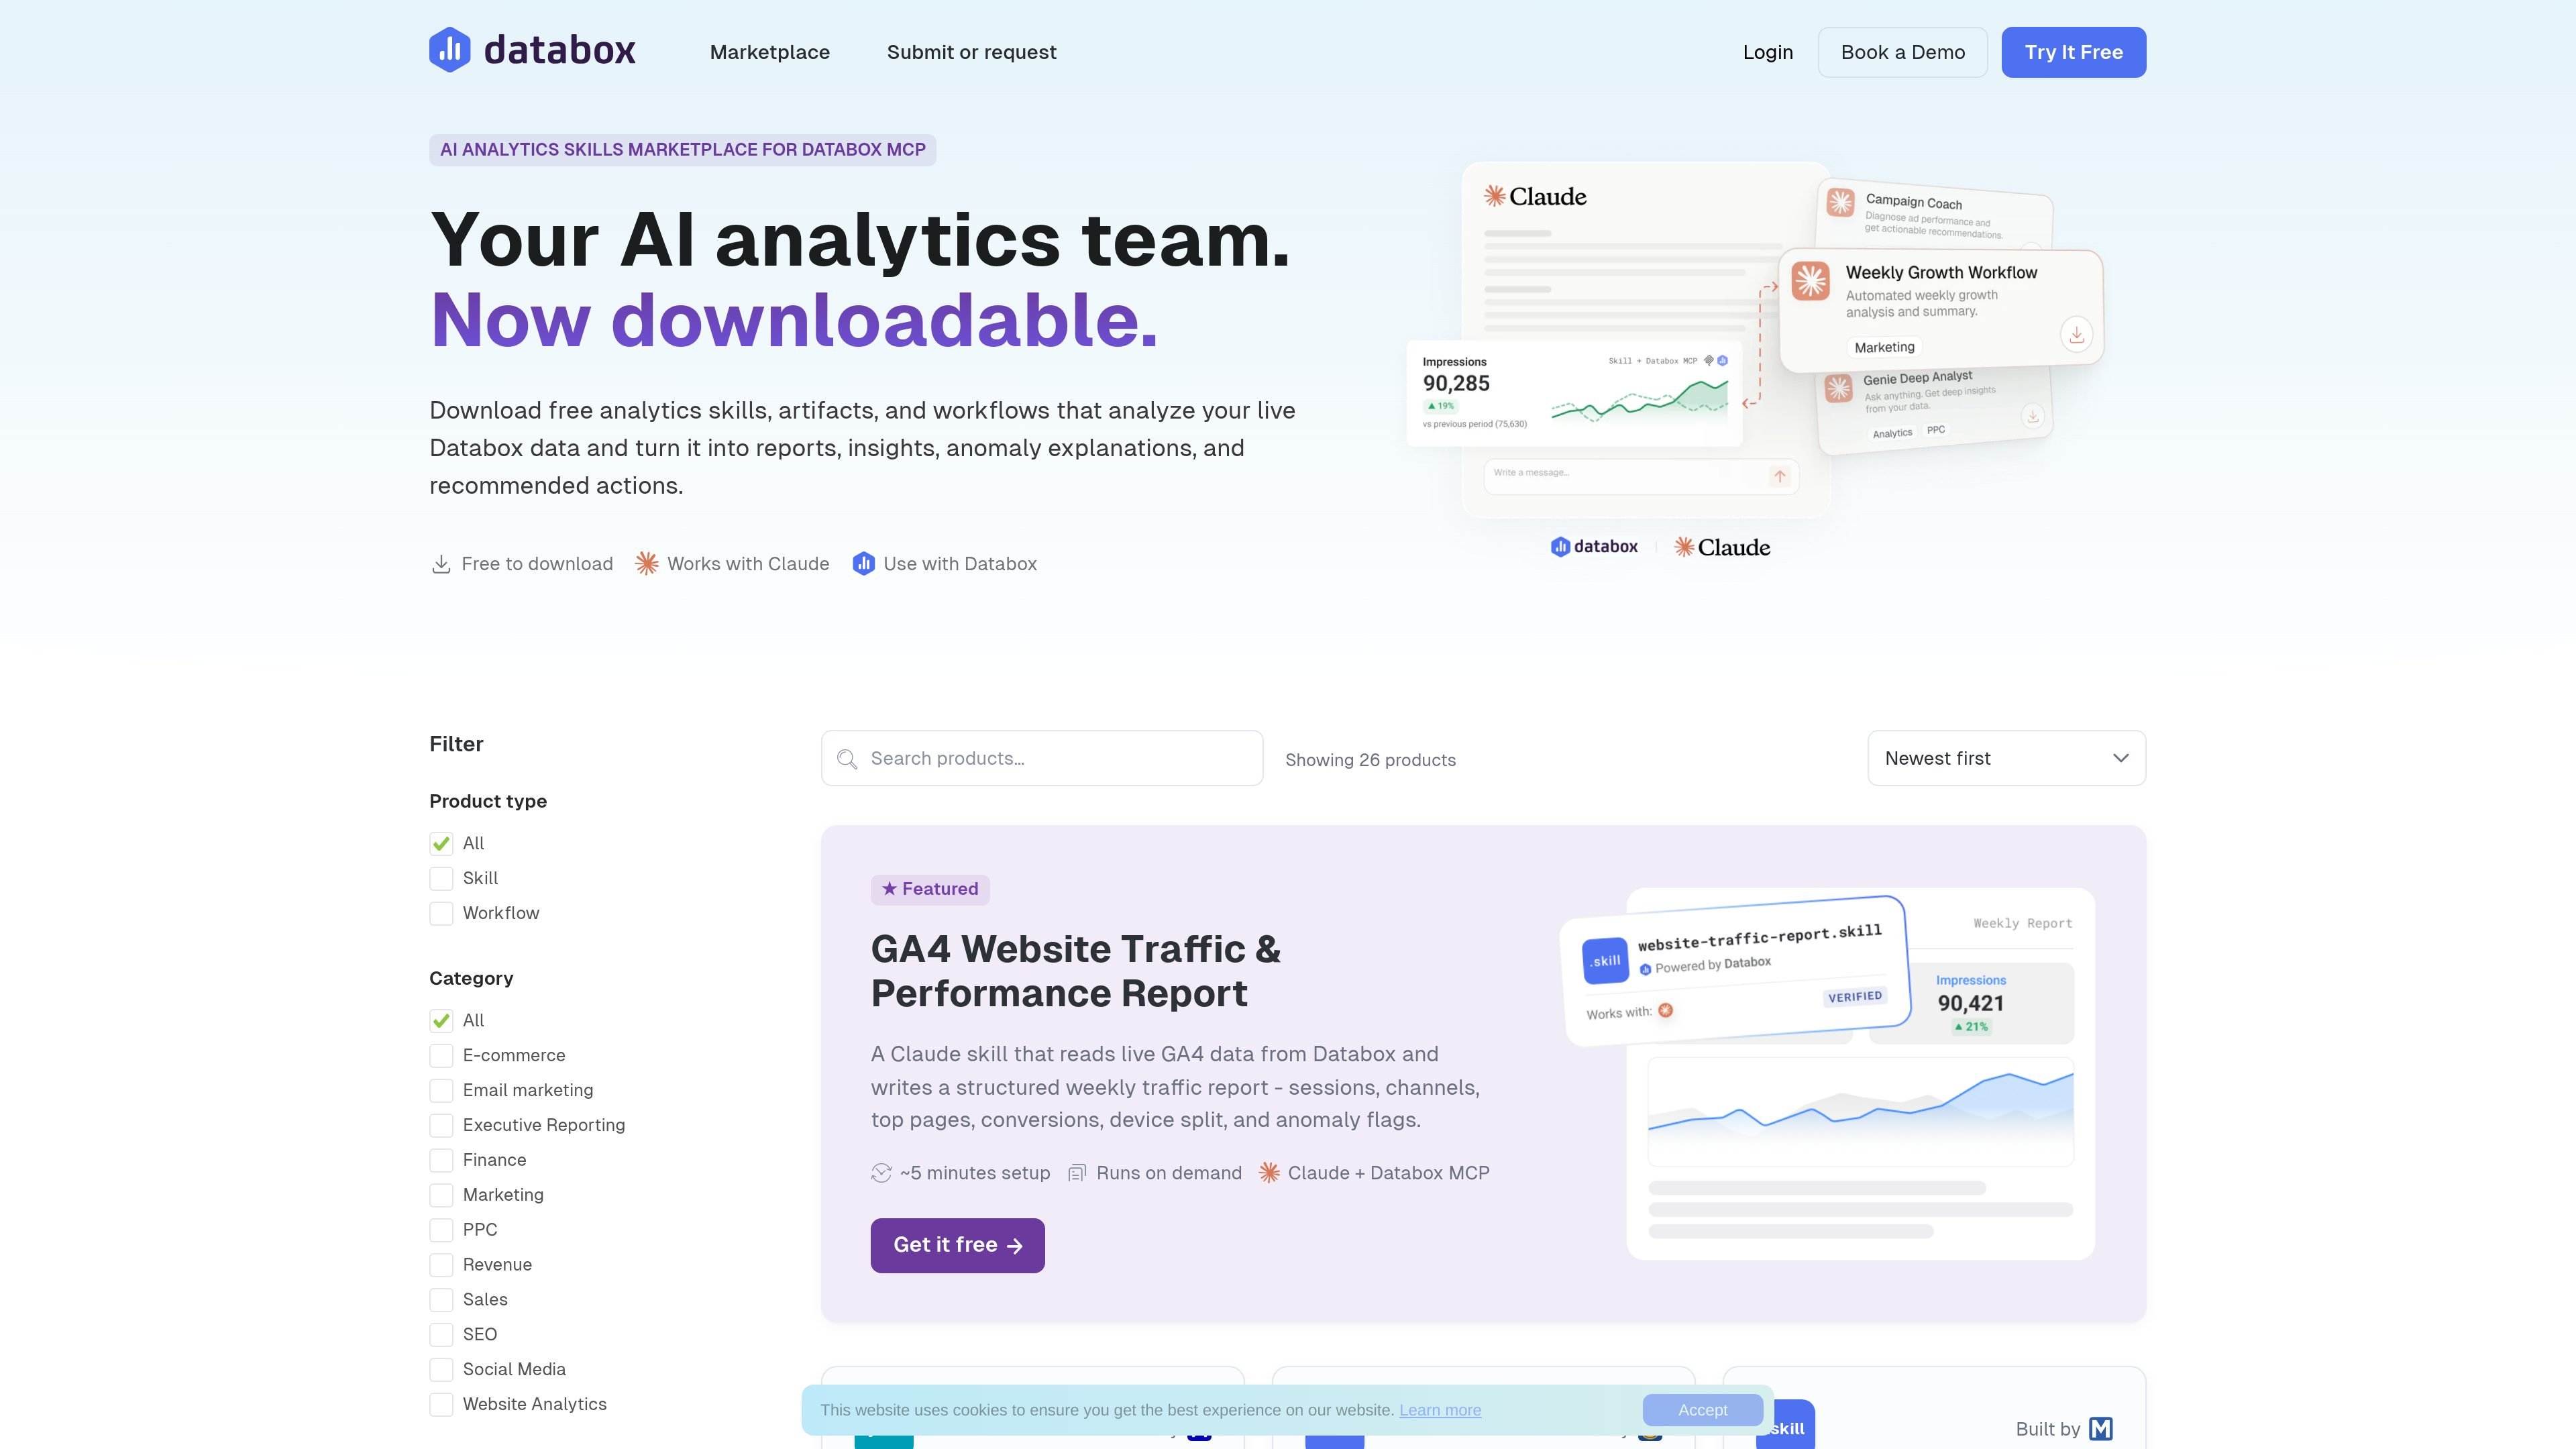
Databox 是一個分析平台,將即時商業資料連接到報表、洞察與行動流程。可把 GA4、Google Ads、Shopify、CRM 系統與試算表等工具中的指標,轉化為儀表板、報告、警示與 AI 生成分析。
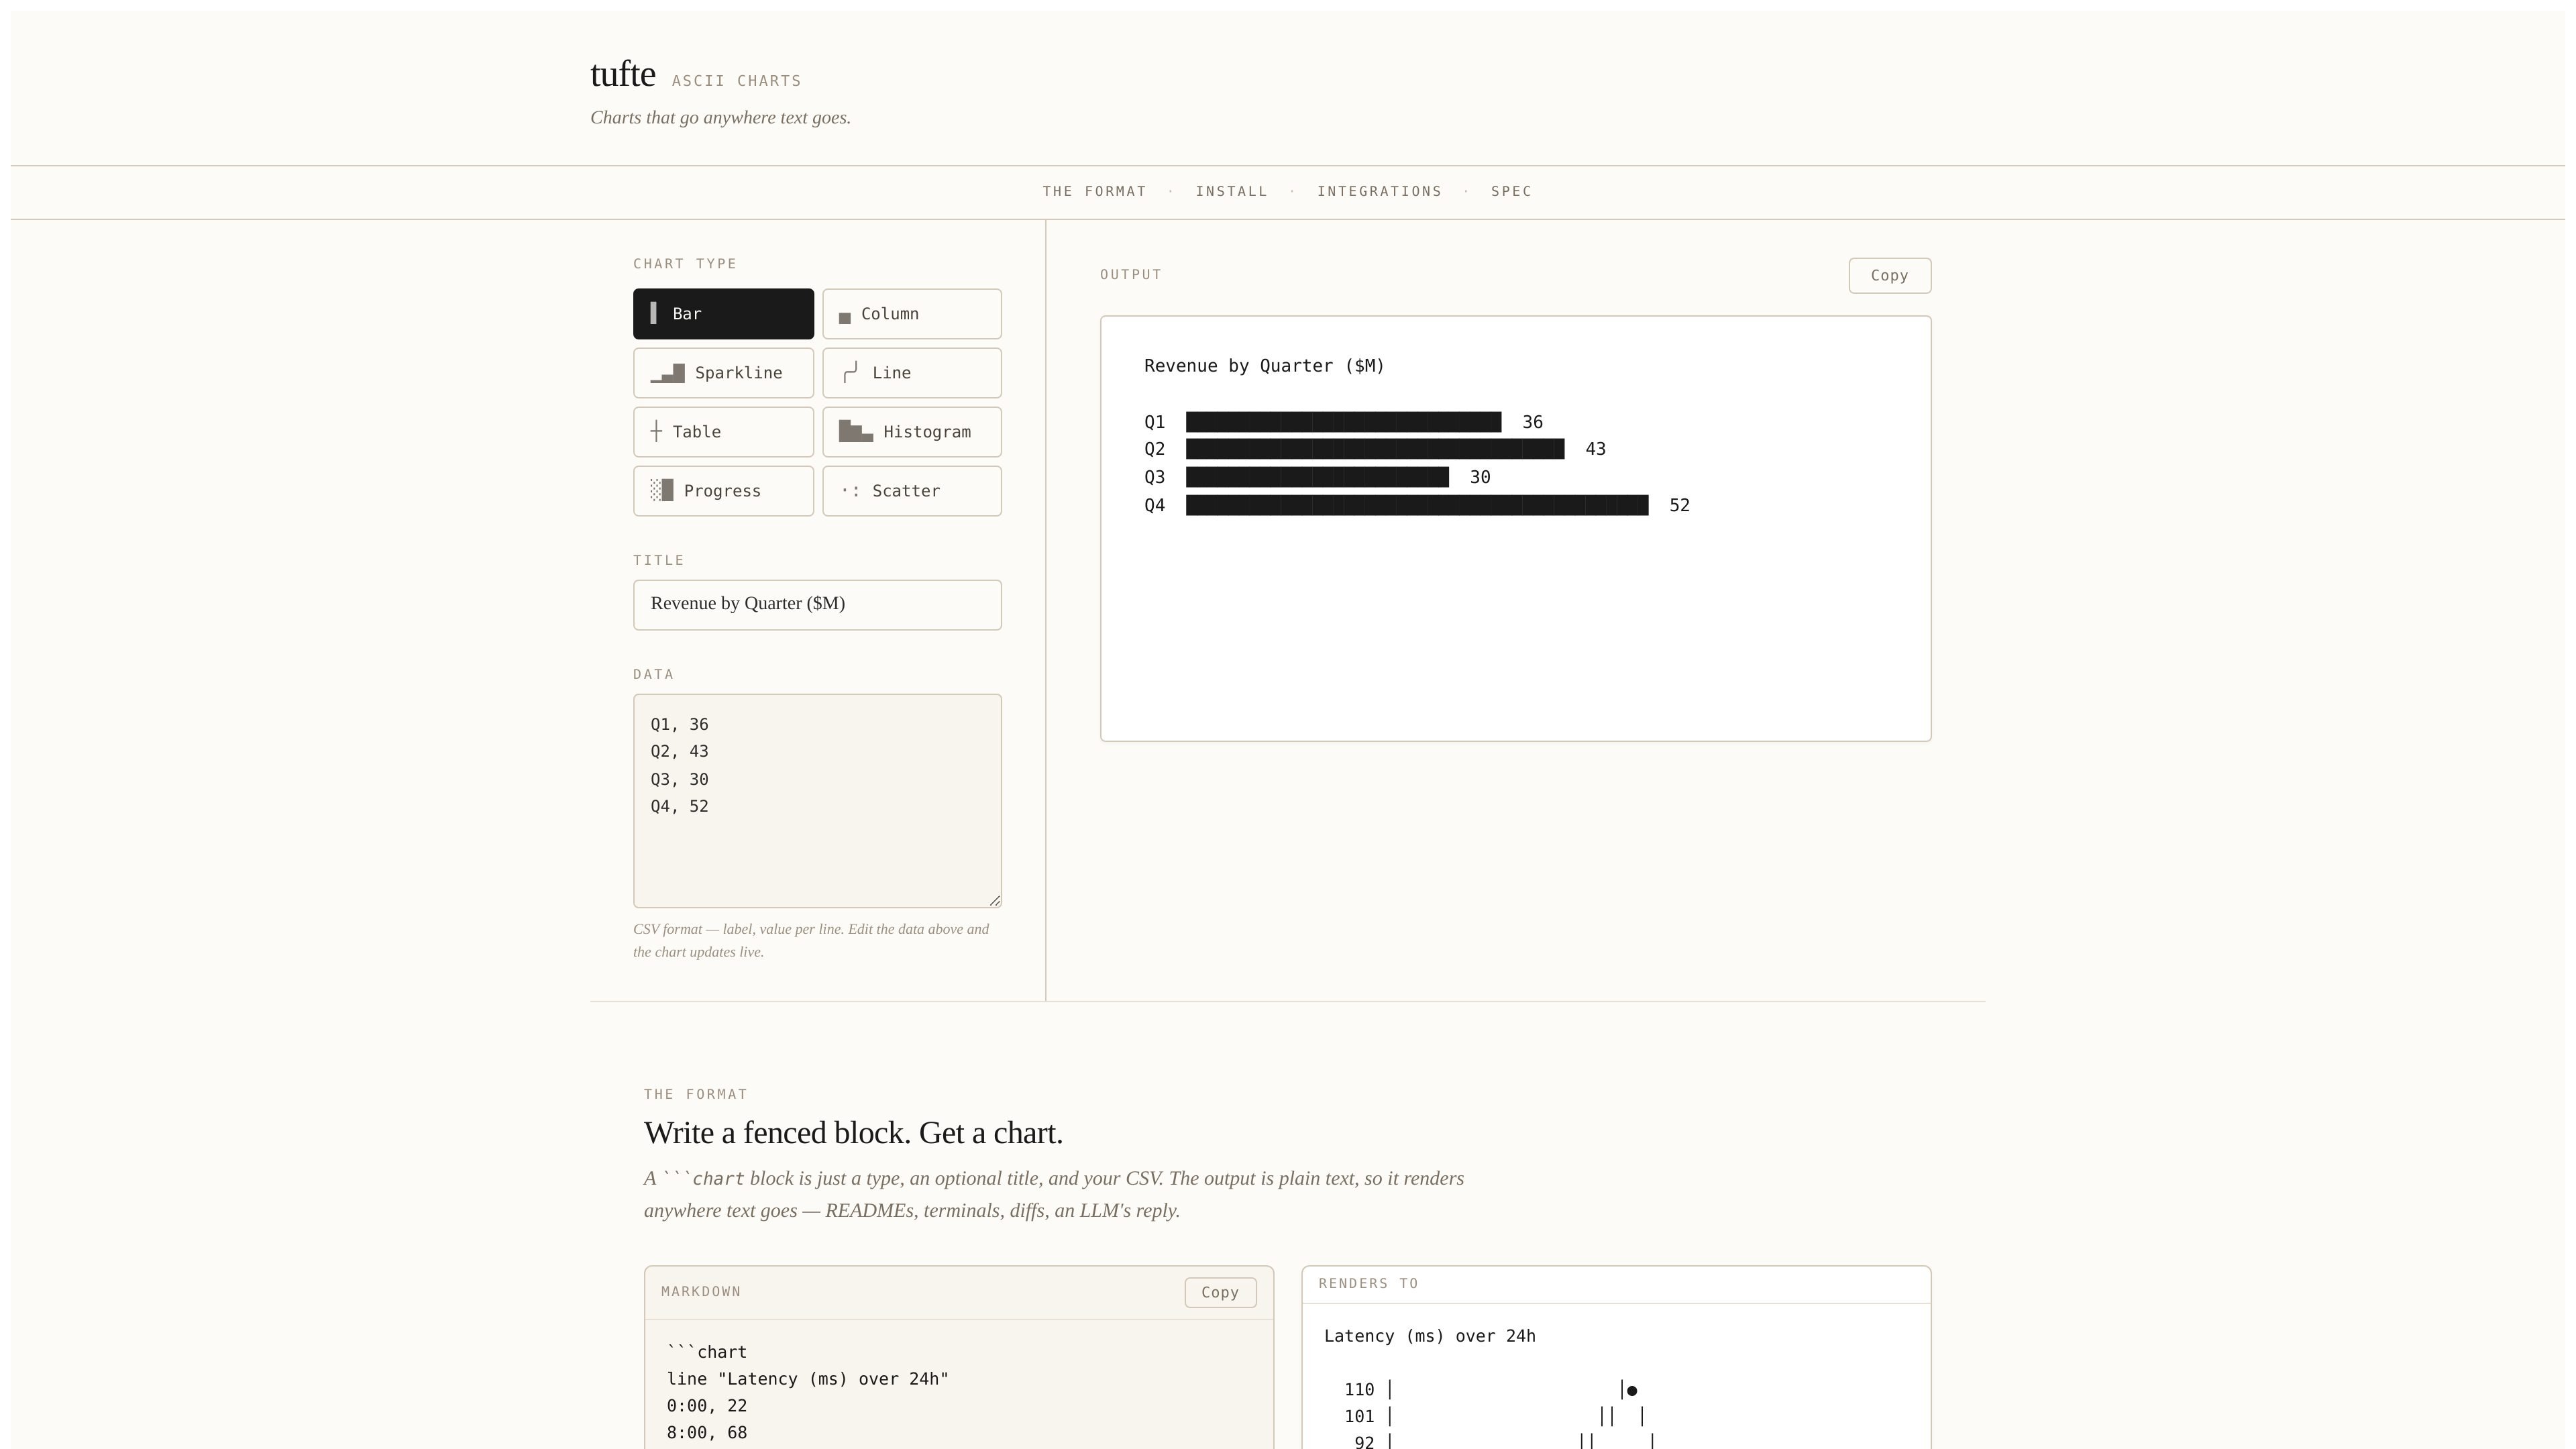
tufte 將 CSV 格式資料轉成適合 Markdown、終端機與其他以文字為主流程使用的純文字 ASCII 圖表。支援 fenced `chart` 區塊、內嵌 sparklines 與多種發布整合方式。
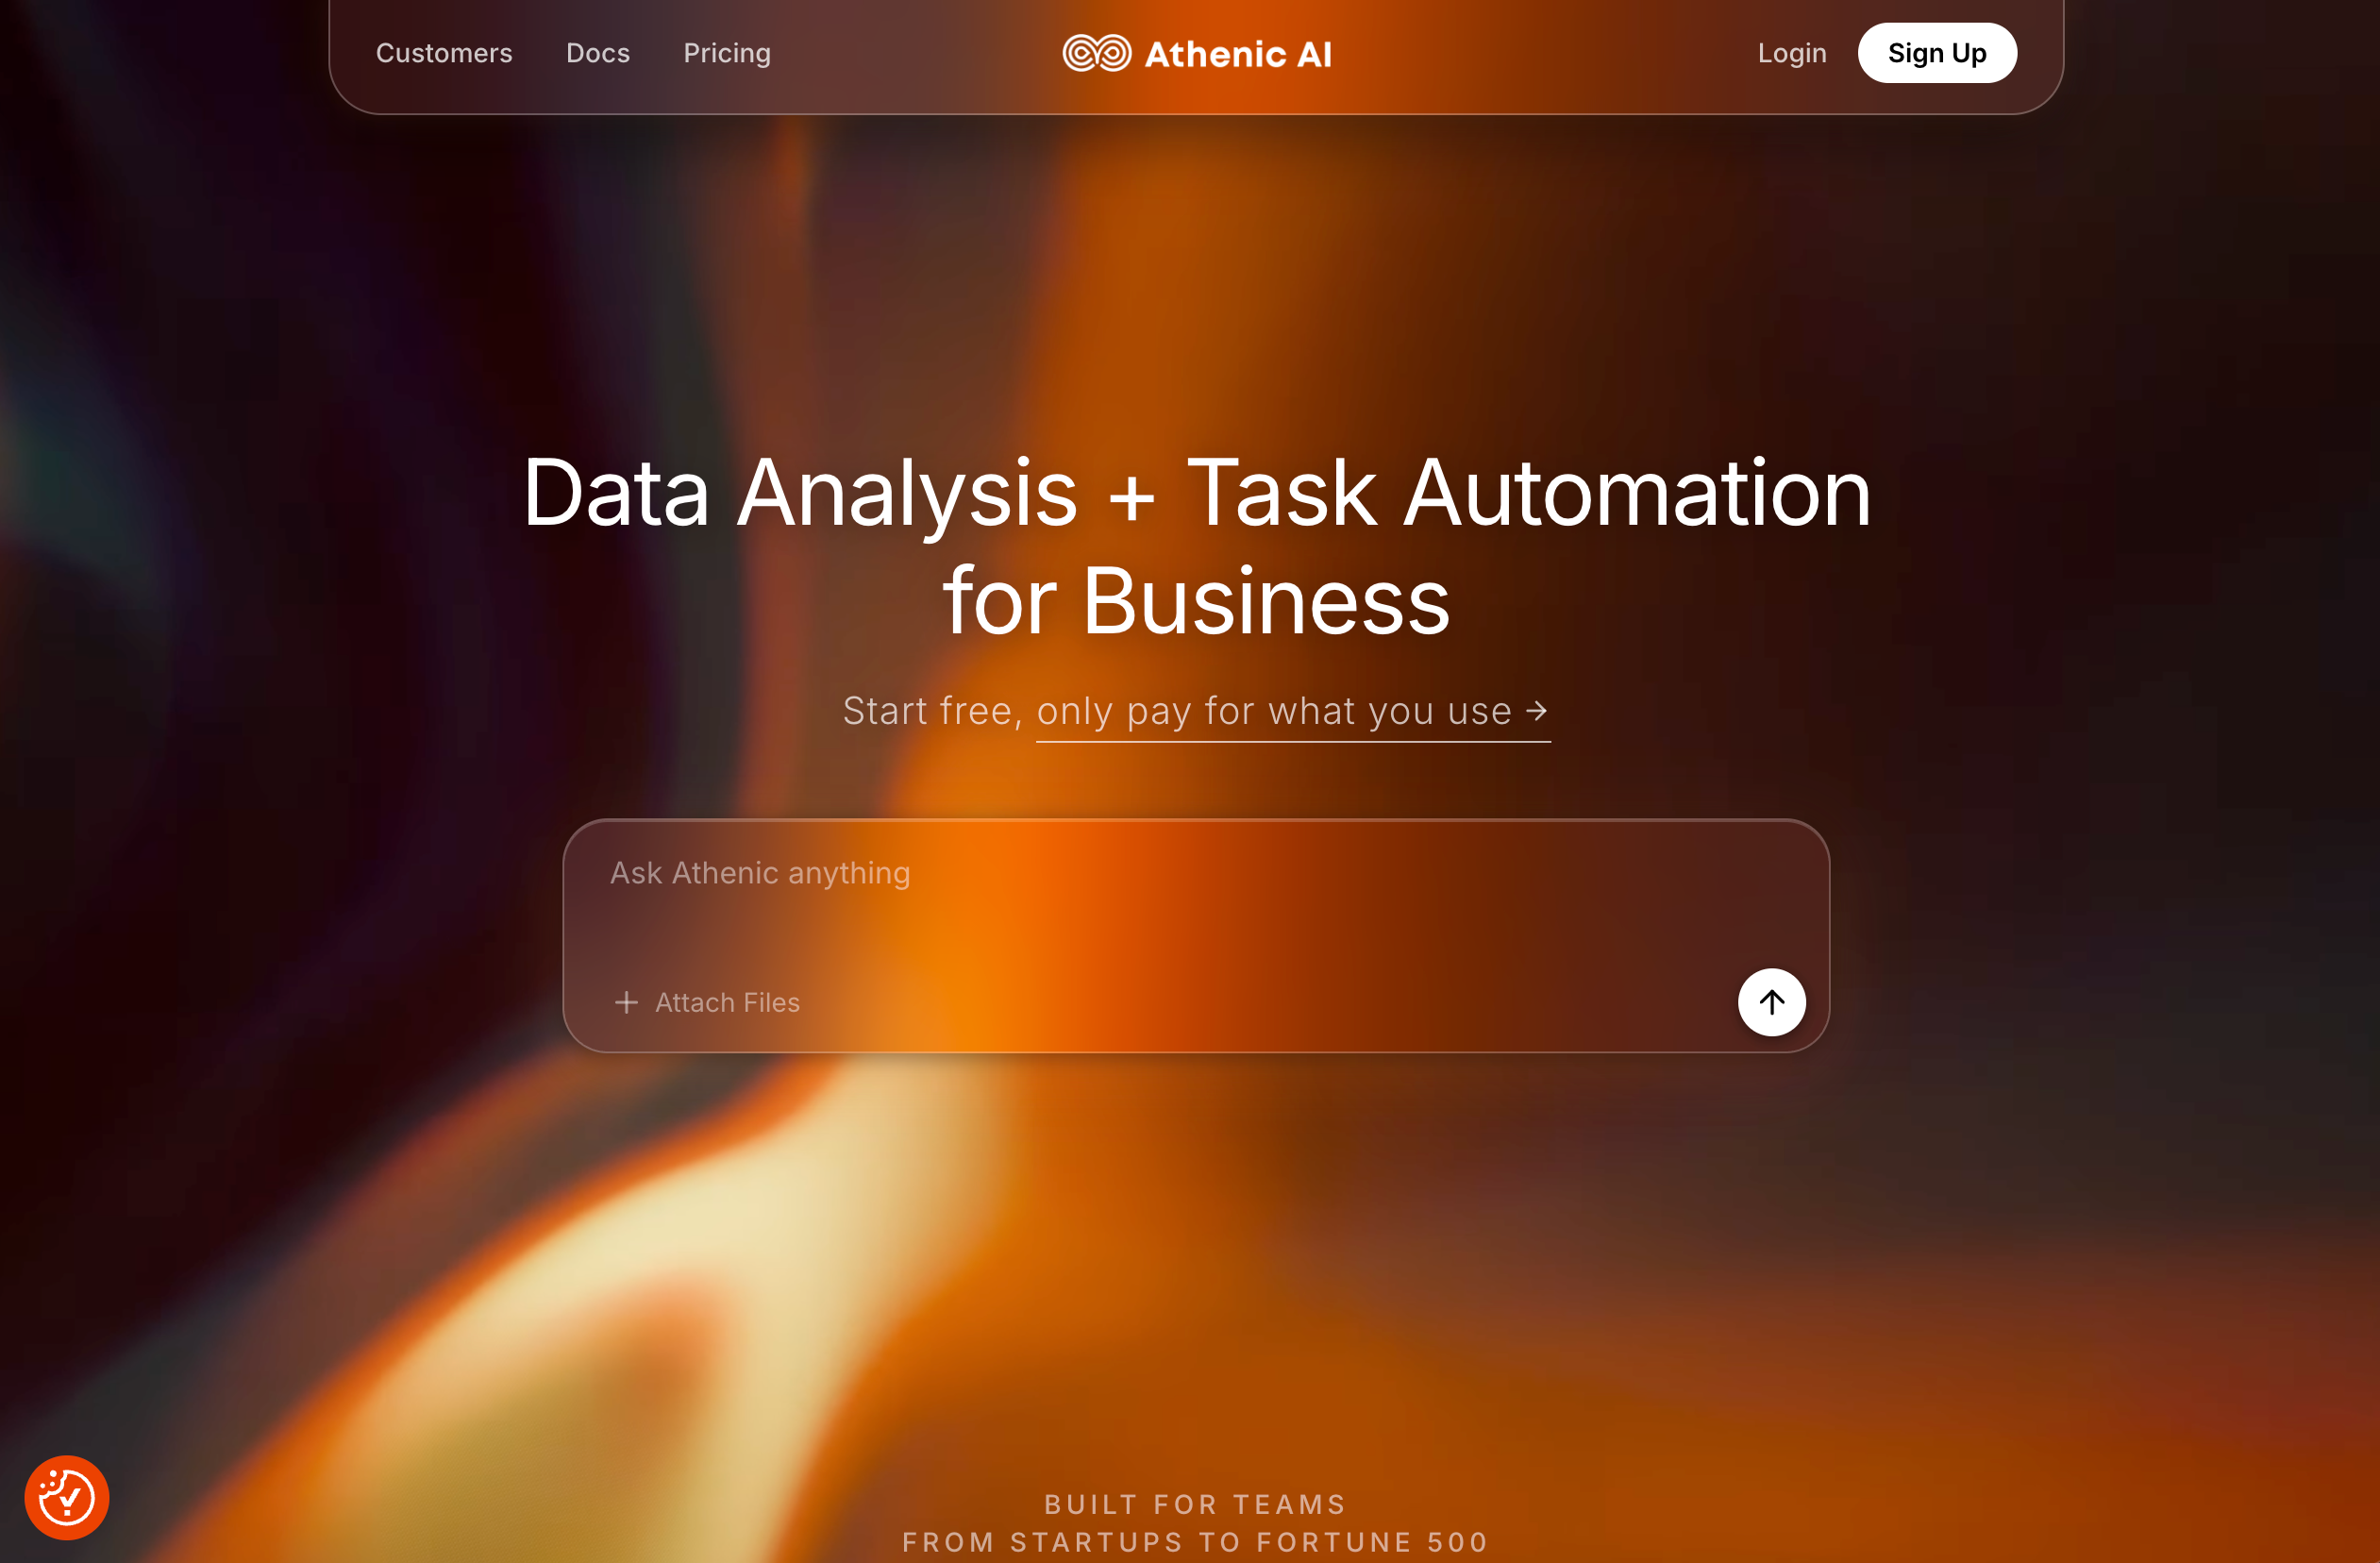
Athenic 是一款用於資料分析與工作自動化的 AI 代理,支援連接資料、以自然英文提問,並將分析結果轉為儀表板、報告與自動化流程。
HelioPeak 是一款原生 iOS App,可透過 PVOutput.org 追蹤太陽能發電,提供圖表、小工具、匯出與系統統計,支援 iPhone、iPad 與 Apple Silicon Mac。
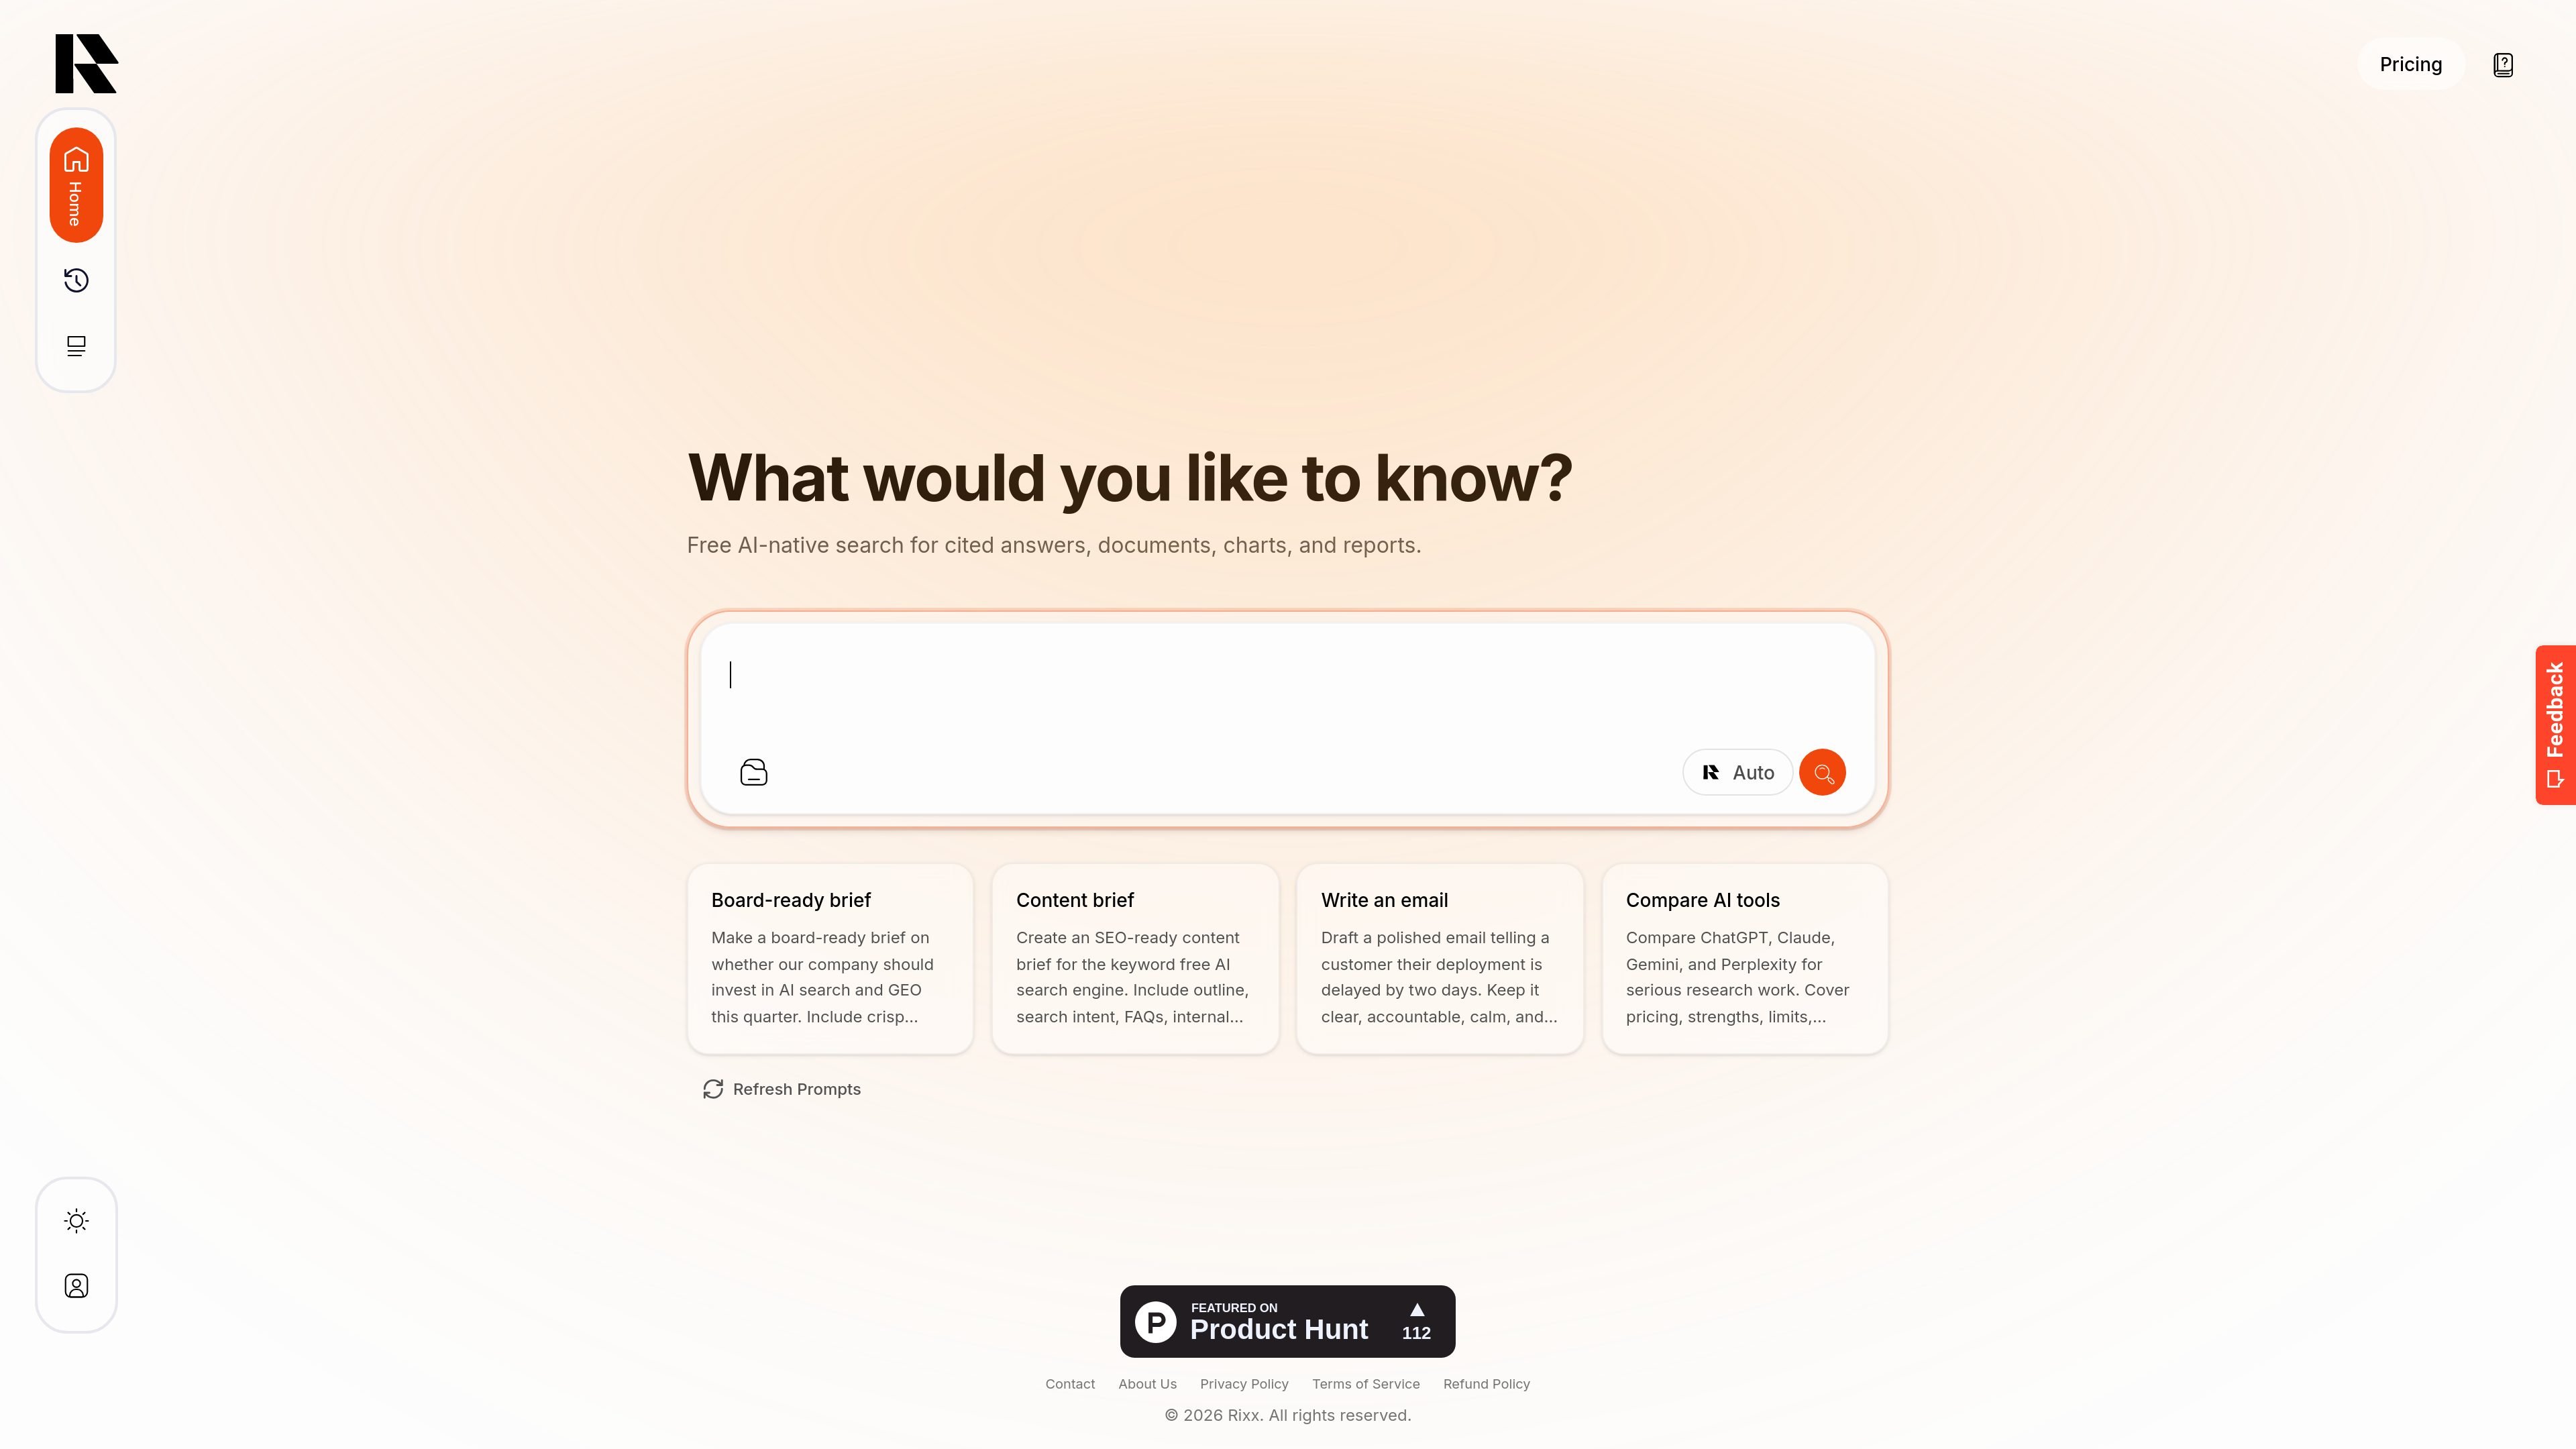
Rixx 是一款 AI 原生搜尋工作空間,提供具引用來源的答案、文件分析、圖表與報告。協助研究者、分析師、創辦人、學生、寫作者與營運人員,將網路與檔案研究轉為可重複使用的成果。

Embedful 免費圖表產生器可將 CSV 與 Excel 檔快速轉成可分享圖表,免寫程式、免註冊,支援多種圖表類型,並可匯出 PNG、SVG、PDF。
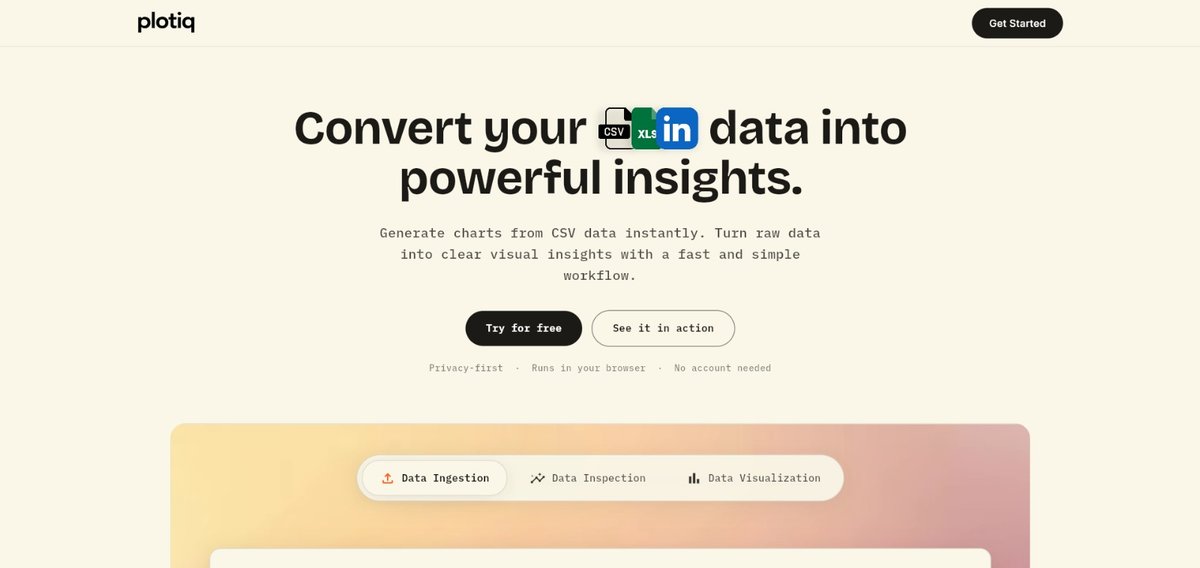
Plotiq 是一款瀏覽器版 CSV 圖表產生器,可快速將表格資料轉為長條圖、折線圖、散點圖與圓餅圖。支援免程式碼流程:上傳 CSV、選擇欄位、挑選圖表並下載或分享。
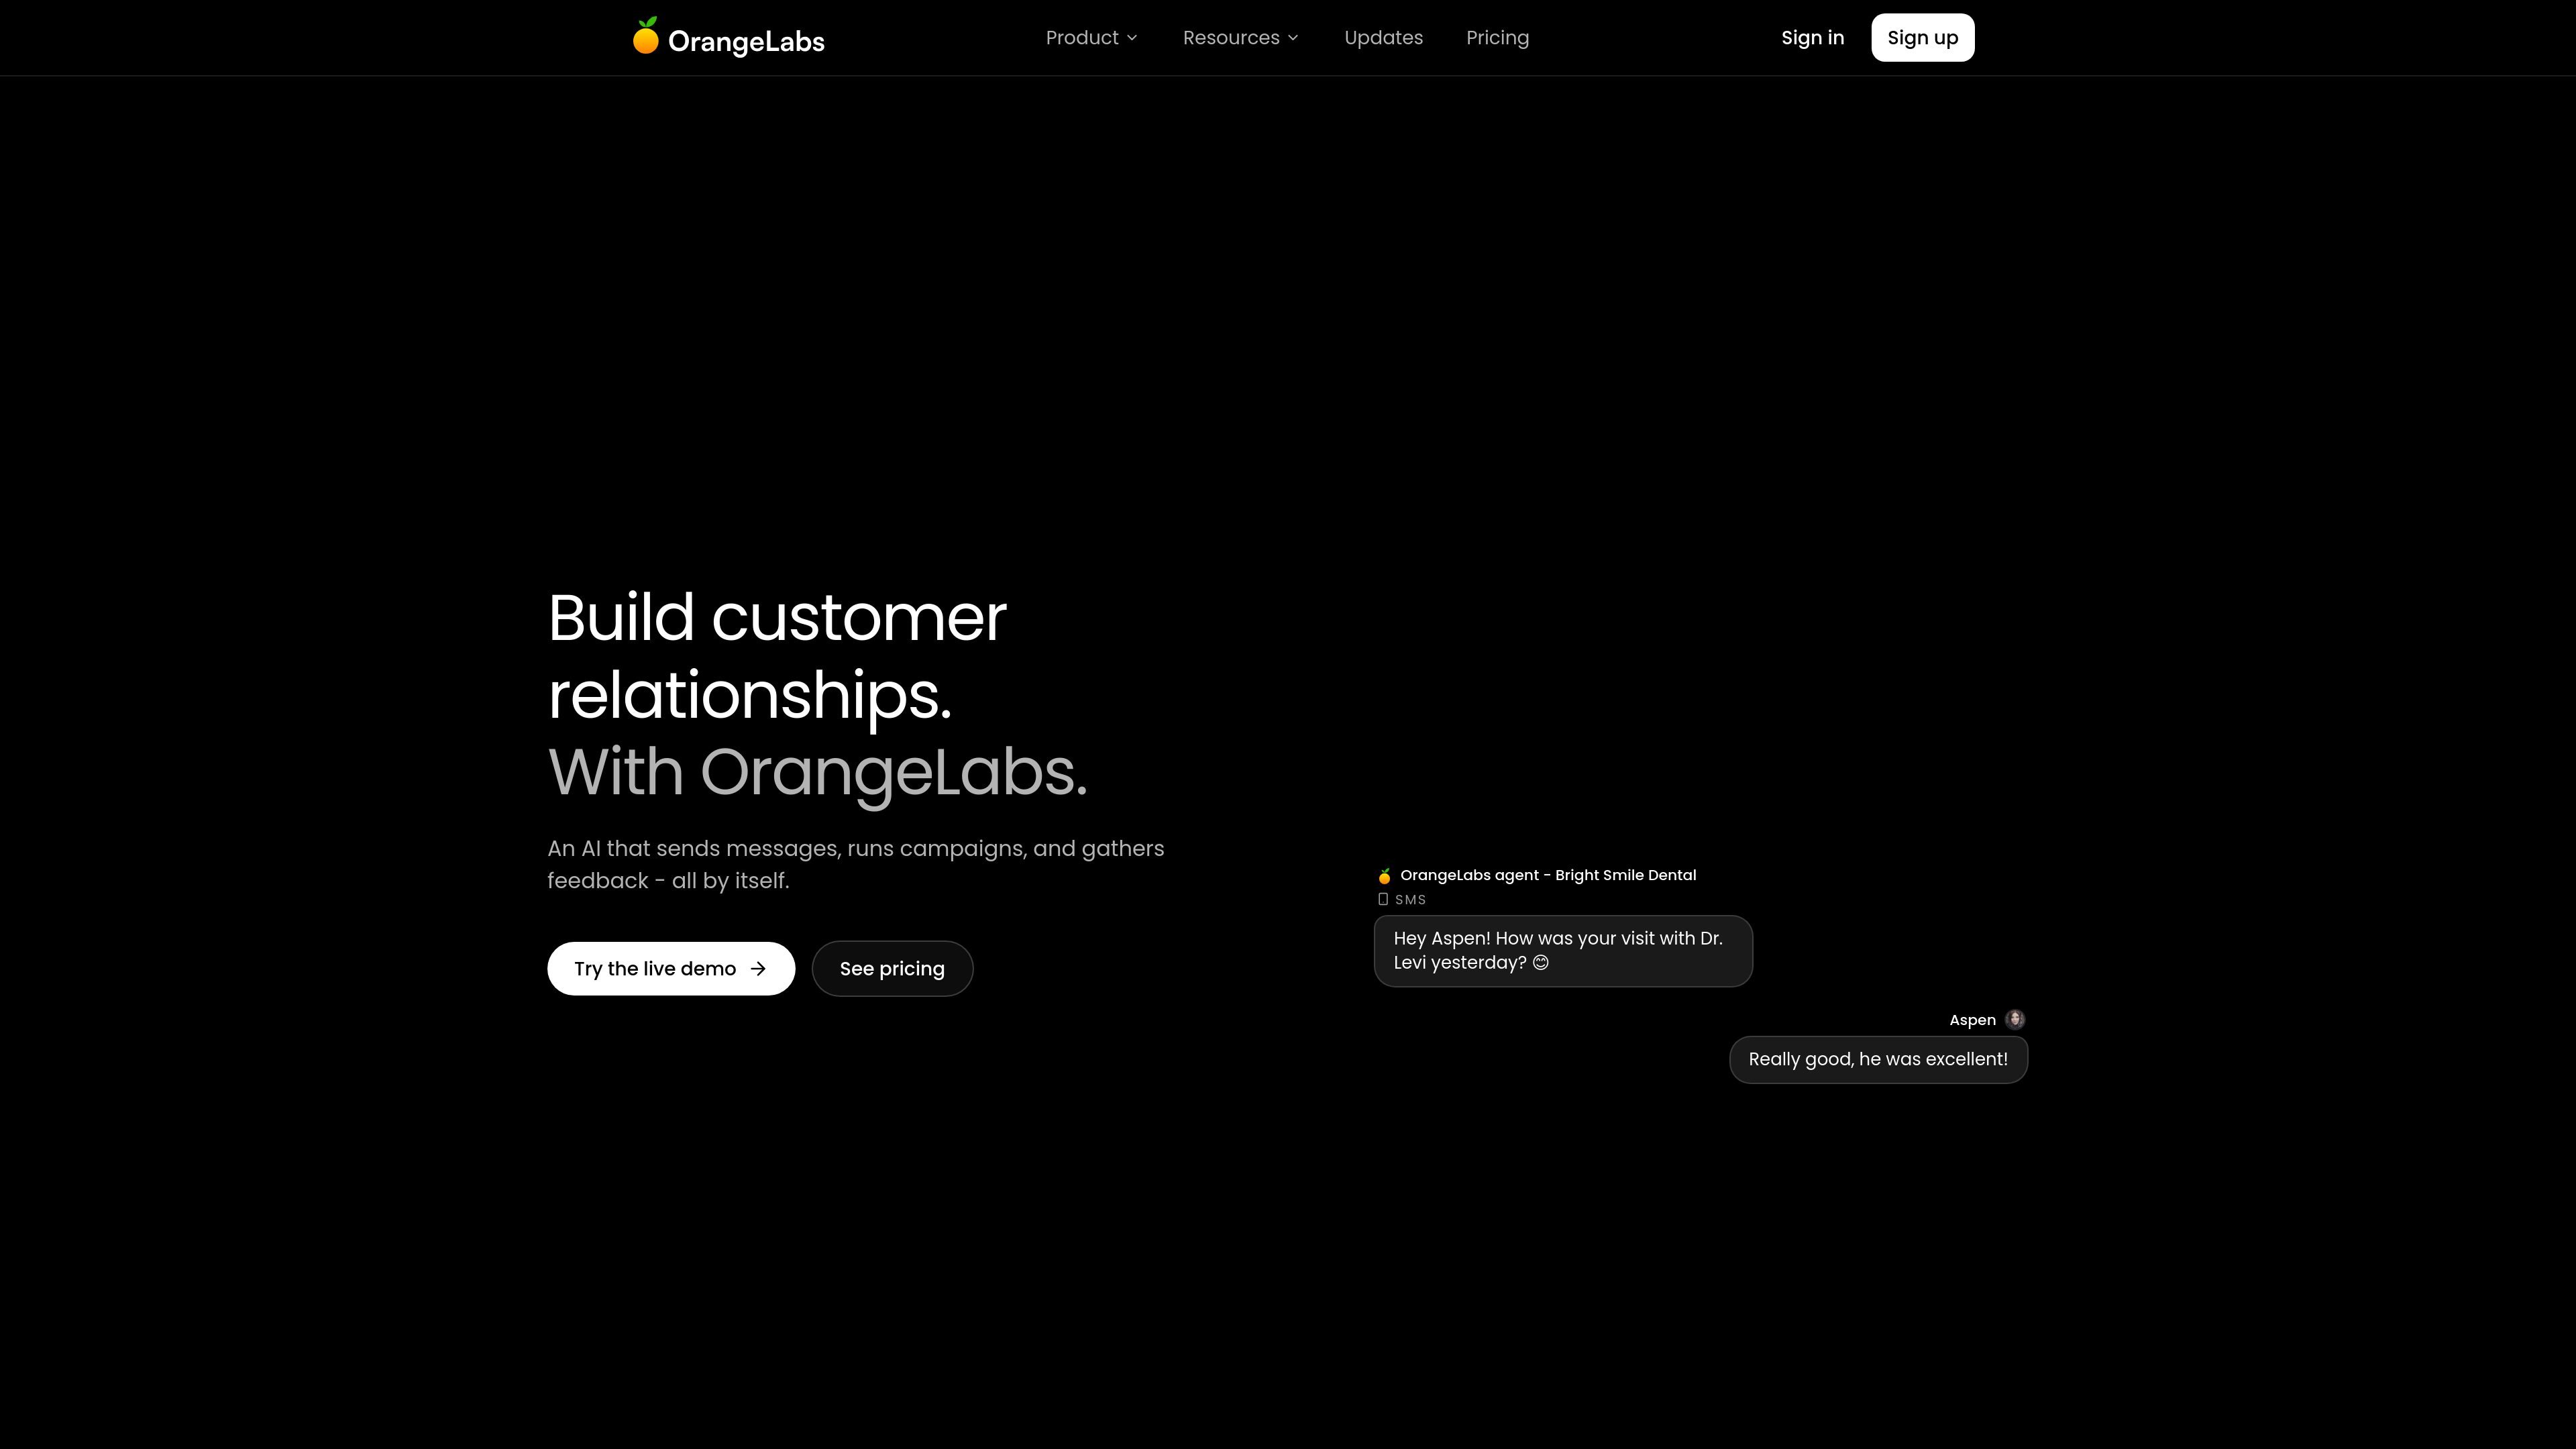
OrangeLabs 是 AI 資料視覺化平台,協助非技術使用者查詢原始資料、建立互動圖表,並將洞察轉為簡報可用輸出。含常見商務串接與 Starter 方案 7 天免費試用。
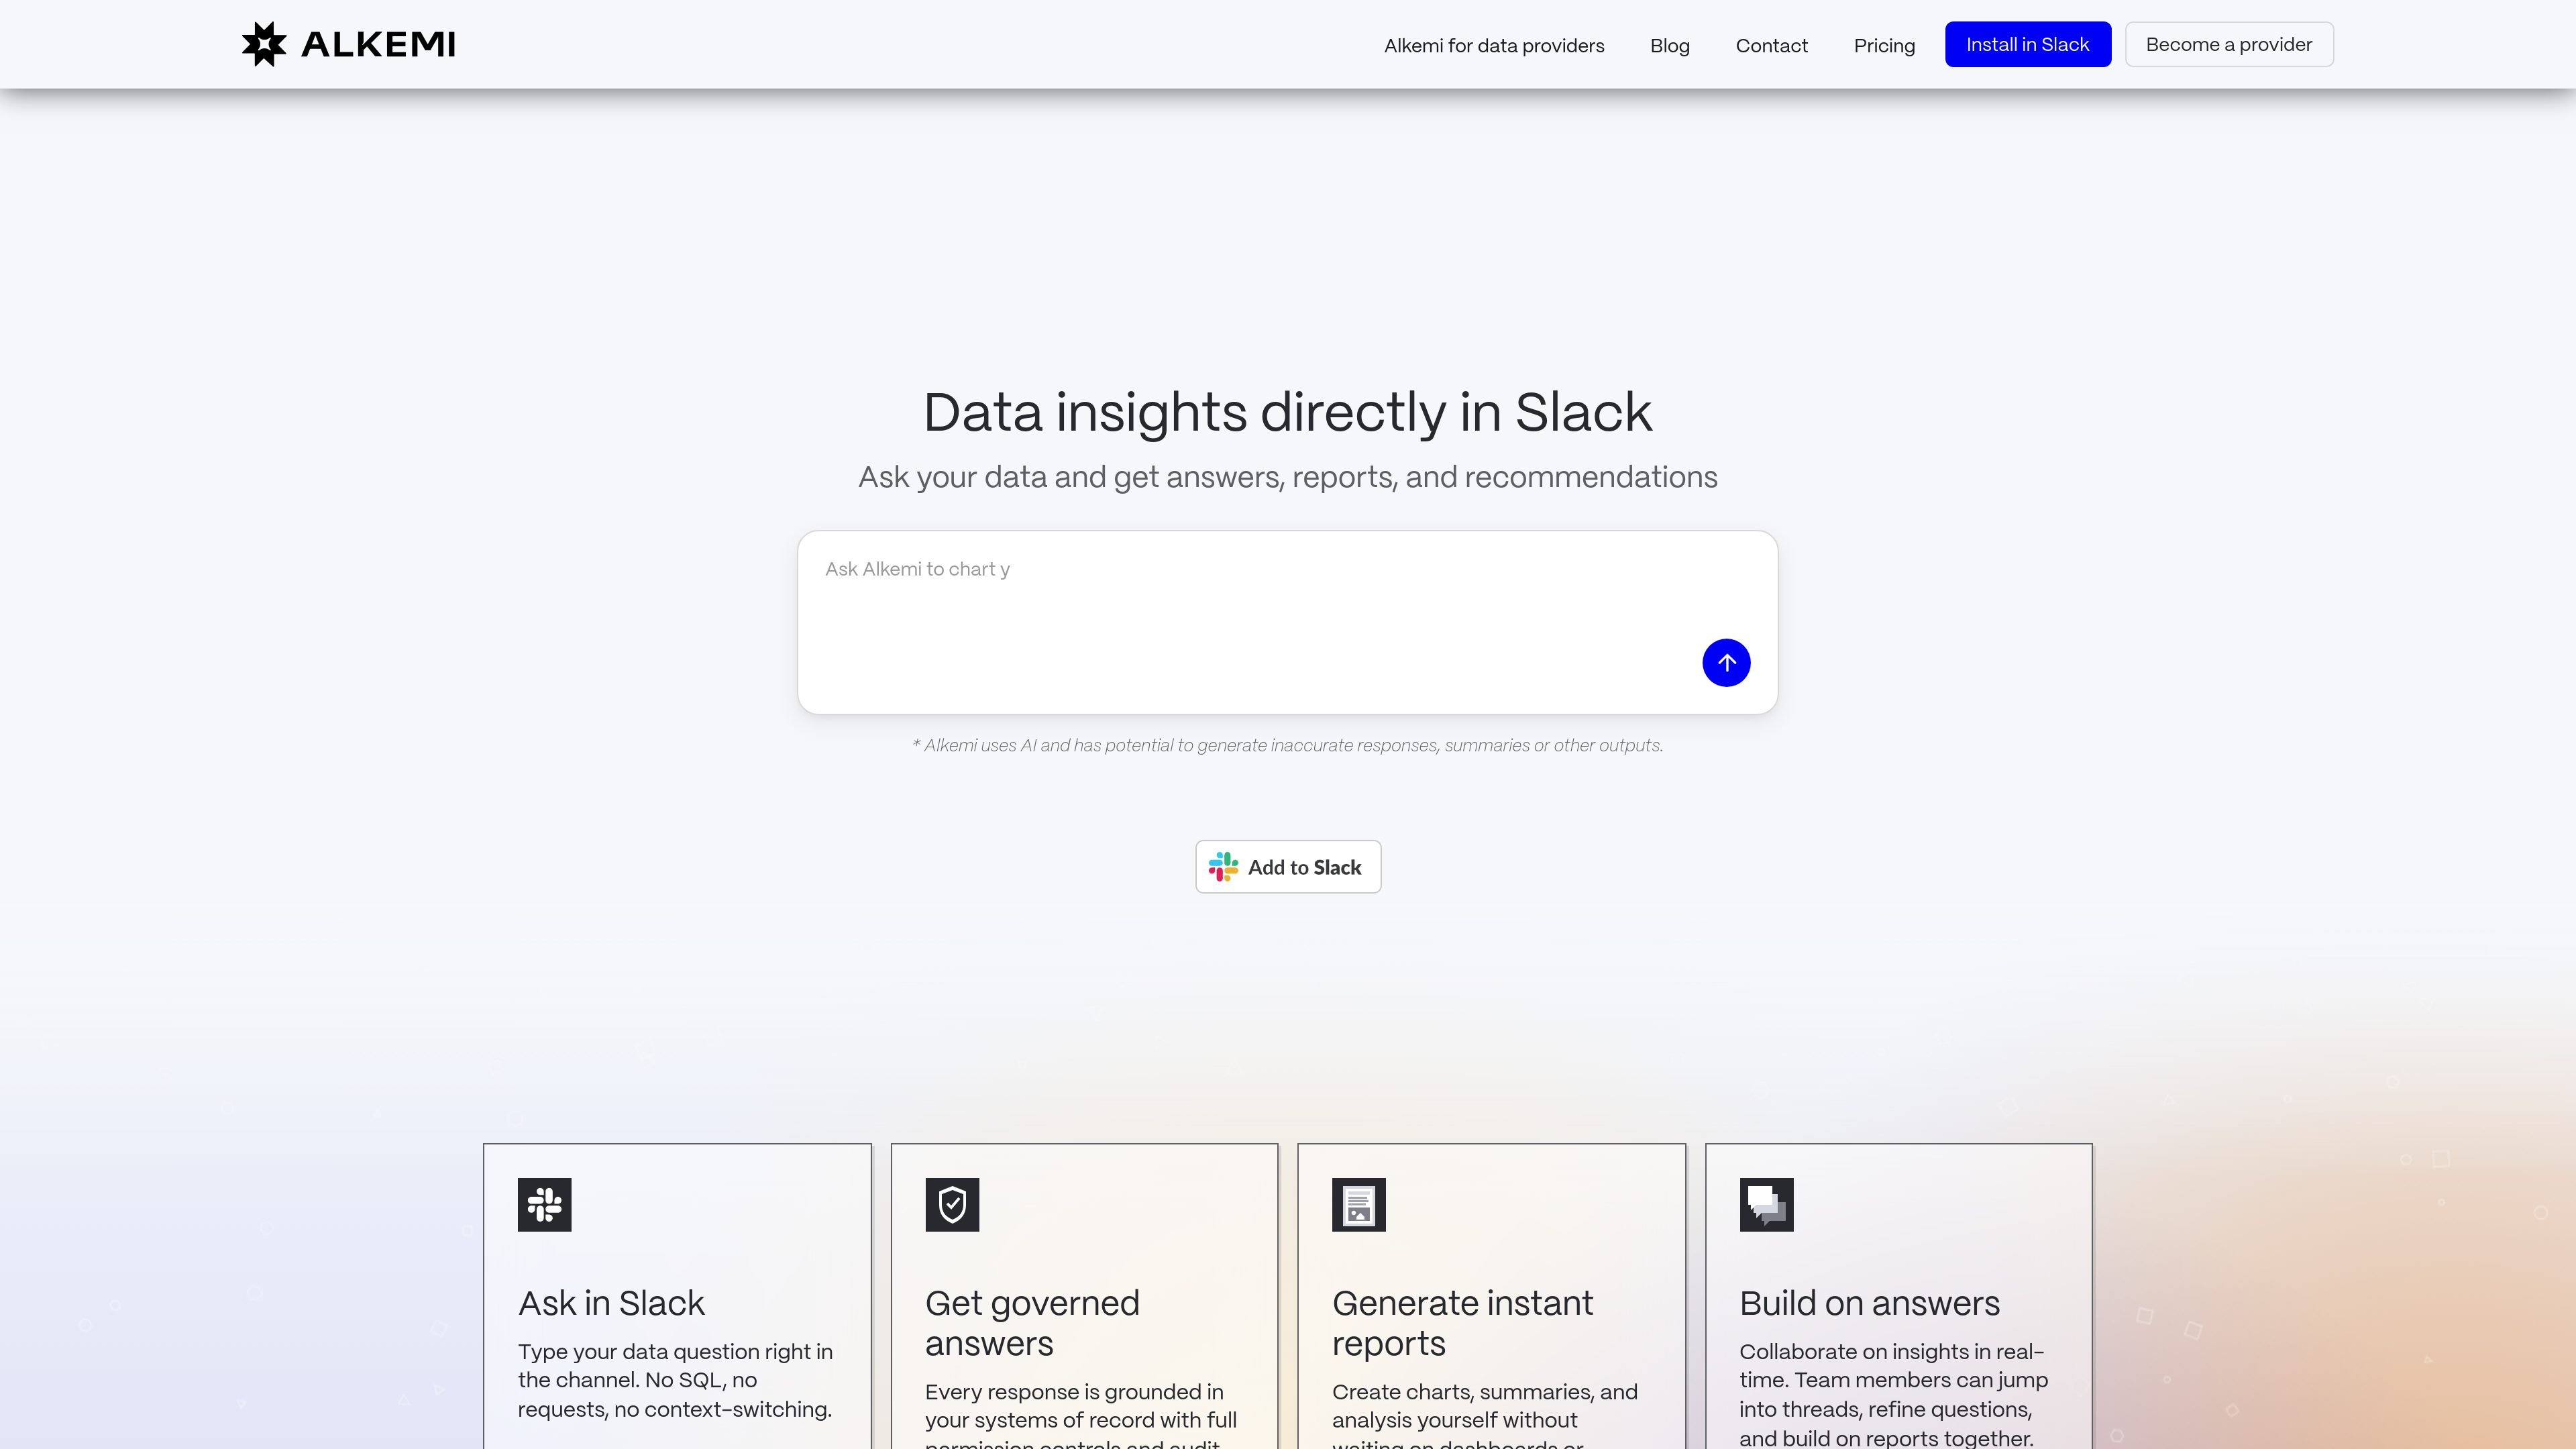
Alkemi Slack agent 讓團隊在 Slack 中用自然語言提問資料問題,並在對話串中取得受治理的答案、圖表與報告,無需切換工具或等待分析師。
ExcelFormuLab 將你的問題轉成答案、圖表與匯出結果。上傳或連接資料,進行分析/轉換並提供可檢視程式碼。

Bricks 是一款網頁版 AI 資料分析工具,可將 CSV、Excel、PDF 與 PNG 資料快速轉成儀表板和報表,支援自動圖表生成、手動編輯、分享與匯出,適合個人與團隊使用。