InfoBlog
InfoBlog is an AI-powered platform that turns blogs, articles, reports into infographics and presentations in minutes.
What is InfoBlog?
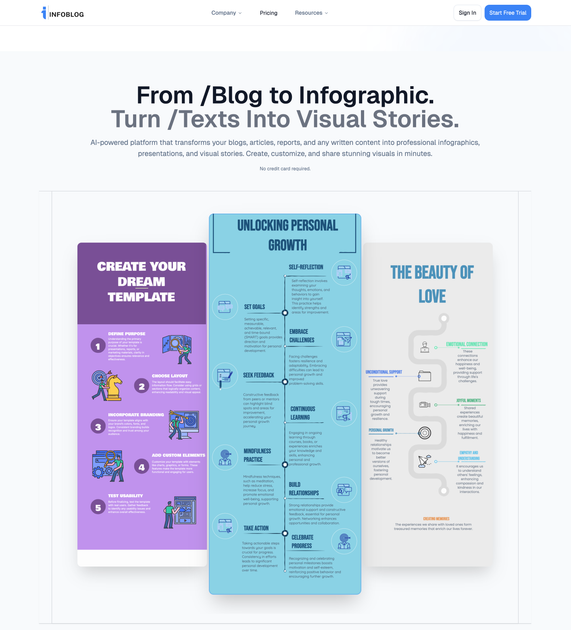
InfoBlog is an AI-powered platform that turns written content—such as blog posts, articles, and reports—into visual outputs. Its core purpose is to help you convert text into professional-looking infographics, presentations, and other visual stories in minutes.
The platform focuses on taking existing content you’ve already written and restructuring it into visuals you can use for communication, sharing, or internal/external reporting.
Key Features
- AI-based content-to-visual conversion: Transform written text (blogs, articles, reports) into visual formats so you don’t have to start designing from scratch.
- Multiple visual output types: Generate infographics and presentations from the same source content for different sharing contexts.
- Designed for quick turnaround: The product positions itself around producing results in minutes, supporting faster content repurposing.
How to Use InfoBlog
- Provide or paste the written content you want to convert (e.g., a blog post, article, or report).
- Choose the visual format you want to create (infographic or presentation).
- Review the generated visual output and use it as your visual story for sharing or publishing.
Use Cases
- Repurposing blog posts into infographics: Take a published or draft blog article and convert key points into a shareable infographic.
- Converting a report into a presentation: Use a written report to produce a presentation format for meetings or stakeholder updates.
- Turning long-form articles into visual summaries: Transform an article into a visual story that highlights the main ideas in an easier-to-scan format.
- Creating visual content for teams: Repurpose internal written documentation (reports or updates) into presentation-ready visuals for work communication.
FAQ
-
What types of content can I convert? InfoBlog is described as converting blogs, articles, reports, and other written content into visuals.
-
What visual formats does InfoBlog generate? The page specifically mentions infographics and presentations, described as “visual stories.”
-
How fast can I create visuals? The meta description states the platform can transform content into visuals “in minutes,” though no further timing details are provided.
-
Do I need to create design assets manually? The platform is positioned as an AI tool that transforms your existing written content into visual outputs, reducing the need to design from the ground up.
Alternatives
- AI slide or presentation generators: Tools that focus on turning text into slide decks for meetings; these may emphasize slide layout and speaker-readiness over infographic-first output.
- Infographic creation tools: Design platforms that help you build infographics from scratch or with templates; compared with InfoBlog, they may require more manual layout work but can offer more direct control.
- Diagramming and visual documentation tools: Applications for transforming or structuring information into diagrams; these typically center on diagram creation rather than converting narrative blog/report text into polished presentation visuals.
- Content repurposing workflows with templates (manual or semi-automated): Approaches that use templates to reshape existing content into visual formats; these may trade automation speed for consistent brand/template control.
Alternatives
Slidesgo
Discover free Google Slides themes and PowerPoint templates on Slidesgo. Download and customize online to create presentations.
MagicSlides
MagicSlides is an AI-powered PPT maker that transforms any content source into professional presentations in seconds.
Faces
Faces: AI platform for interactive presentations. Create engaging, explorable decks beyond static slides for better audience engagement.
PXZ AI
An All-In-One AI Platform that combines tools for image, video, voice, writing, and chat to enhance creativity and collaboration.
Grok AI Assistant
Grok is a free AI assistant developed by xAI, engineered to prioritize truth and objectivity while offering advanced capabilities like real-time information access and image generation.
Creativly
Creativly is a browser-based creative tool that helps you create without writing prompts—generate creative outputs fast with a simple workflow.