NetworkSpy
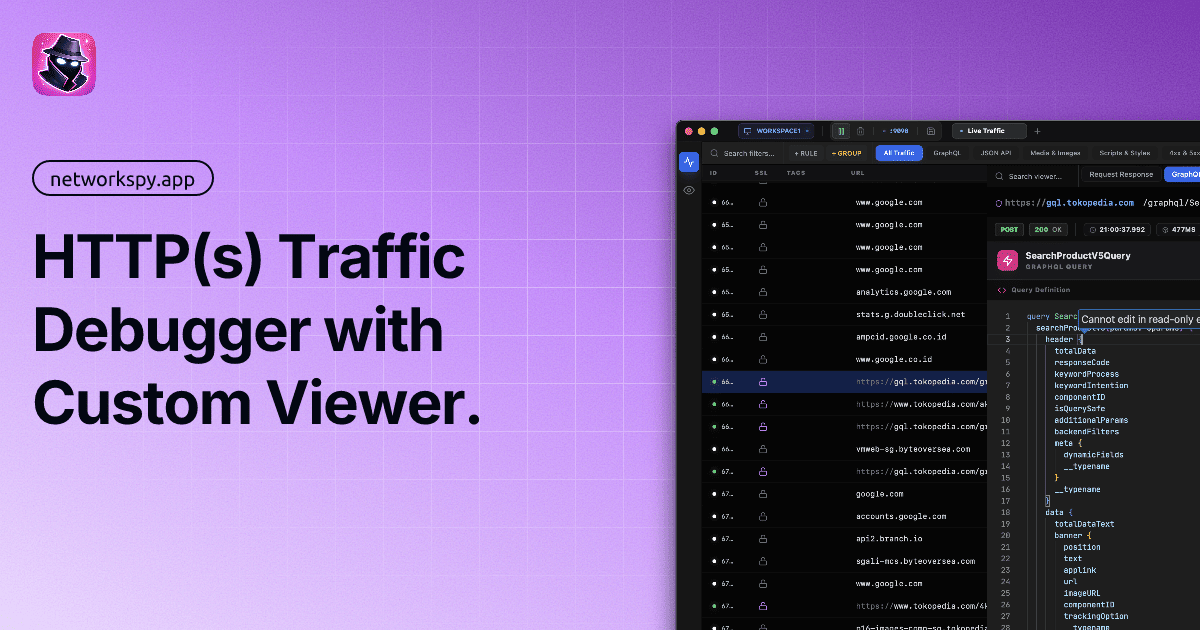
NetworkSpy is an HTTP traffic debugger for inspecting, replaying, and modifying API traffic, including GraphQL, streaming, and AI requests.
What is NetworkSpy?
NetworkSpy is an HTTP traffic debugger for inspecting, analyzing, and modifying modern application traffic. It is built for workflows involving GraphQL, streaming responses, and AI applications, and it focuses on capturing HTTPS traffic with tools for request inspection, replay, comparison, and live editing.
The product presents captured traffic in a custom viewer and adds analysis features such as payload inspection, request diffs, latency tracking, and schema-aware GraphQL handling. It also includes options for traffic-based security review, programmable transformations, and custom viewers for specialized data formats.
Key Features
- Seamless SSL/TLS decryption: Captures HTTPS traffic with zero-configuration setup, automatic certificate management, and one-click trust for secure debugging.
- Deep packet inspection: Shows request metadata including headers, raw bodies, timing, and payload details so users can inspect traffic at a granular level.
- Request comparison and replay: Lets users compare two requests side by side, inspect differences in headers and bodies, and replay captured traffic after editing it.
- Live breakpoints and dynamic mapping: Allows traffic to be paused and modified before it reaches a client or server, and supports swapping remote resources with local files during development.
- Query-driven traffic discovery: Includes filtering by host, method, status code, and path patterns through a query builder for navigating large log sets.
- GraphQL and AI-focused analysis: Supports schema-aware GraphQL inspection, streaming token visualization, token usage tracking, chunk latency views, and payload/response comparison for AI requests.
- Programmable workflows and custom viewers: Supports scripting rules for automated transformations and extensible viewers for custom data formats or proprietary payloads.
- Security-oriented auditing: Surfaces common API risks such as IDOR, mass assignment, and sensitive data exposure during inspection.
How to Use NetworkSpy
Start by capturing HTTP(s) traffic in the app and trusting the local certificate if needed for HTTPS interception. Once traffic is flowing, use filters and the query builder to locate specific requests, then open a request to inspect its headers, body, timing, and response details.
From there, you can compare similar requests, replay one with edits, set breakpoints to change live traffic, or map remote resources to local files while iterating on a frontend or API change. For specialized workflows, users can enable GraphQL inspection, AI stream analysis, scripting rules, or custom viewers.
Use Cases
- Debugging API regressions: Compare two similar requests side by side to identify changes in headers, bodies, or response states that may explain a regression.
- Inspecting streaming AI traffic: View token streams in real time, monitor latency per chunk, and compare payloads and responses when debugging GenAI applications.
- Testing edge cases in request handling: Modify a captured request and replay it to see how an API behaves under altered payloads, status codes, or timing conditions.
- Frontend prototyping with local assets: Replace remote resources with local files to test interface changes without waiting for backend updates.
- Reviewing API security risks: Inspect requests for patterns that may indicate issues such as IDOR, mass assignment, or exposure of sensitive data.
FAQ
Does NetworkSpy work with HTTPS traffic? Yes. The product description says it supports full HTTPS interception with automatic certificate management and one-click trust.
Can it help with GraphQL APIs? Yes. NetworkSpy includes schema-aware inspection for GraphQL queries, mutations, and fragments.
Does it support AI and streaming responses? Yes. The page highlights token stream visualization, token usage tracking, latency mapping, and payload/response comparison for AI requests.
Can users customize how data is displayed? Yes. NetworkSpy supports extensible custom viewers, which are intended for specialized payloads and proprietary formats.
Does the source mention pricing or platform support? No. The provided content includes a "Check Pricing" link, but it does not provide pricing details or specific platform compatibility information.
Alternatives
- Fiddler: A general HTTP debugging and inspection tool often used for similar proxy-based traffic analysis workflows.
- Charles Proxy: Another proxy-based network debugging tool commonly used for inspecting and modifying HTTP and HTTPS traffic.
- mitmproxy: An open-source proxy for intercepting and scripting web traffic, with a more code-oriented workflow.
- Browser developer tools: Useful for basic request inspection in a browser, but less suitable when you need full proxy capture, traffic replay, breakpoints, or custom viewers.
Alternatives
PromptScout
PromptScout tracks how your brand is mentioned, which competitors are recommended, and what sources are cited in AI answers—plus website audits.
Sleek Analytics
Lightweight, privacy-friendly analytics with real-time visitor tracking—see where visitors come from, what they view, and how long they stay.
Ably Chat
Ably Chat is a chat API and SDKs for building custom realtime chat apps, with reactions, presence, and message edit/delete.
MacSpoof
MacSpoof is a macOS MAC address changer that lets you change or randomize your Wi‑Fi MAC to reconnect and limit device logging on public Wi‑Fi.
ClawTick
ClawTick is a CLI-first AI agent automation platform for scheduling webhook tasks on cron with monitoring, alerts, retries, and execution logs.
OpenFlags
OpenFlags is an open source, self-hosted feature flag system with a control plane and typed SDKs for progressive delivery and safe rollouts.