Nirixa
Nirixa is an AI observability and cost intelligence tool that tracks each LLM call’s tokens, cost, latency, and hallucination risk via a drop-in SDK.
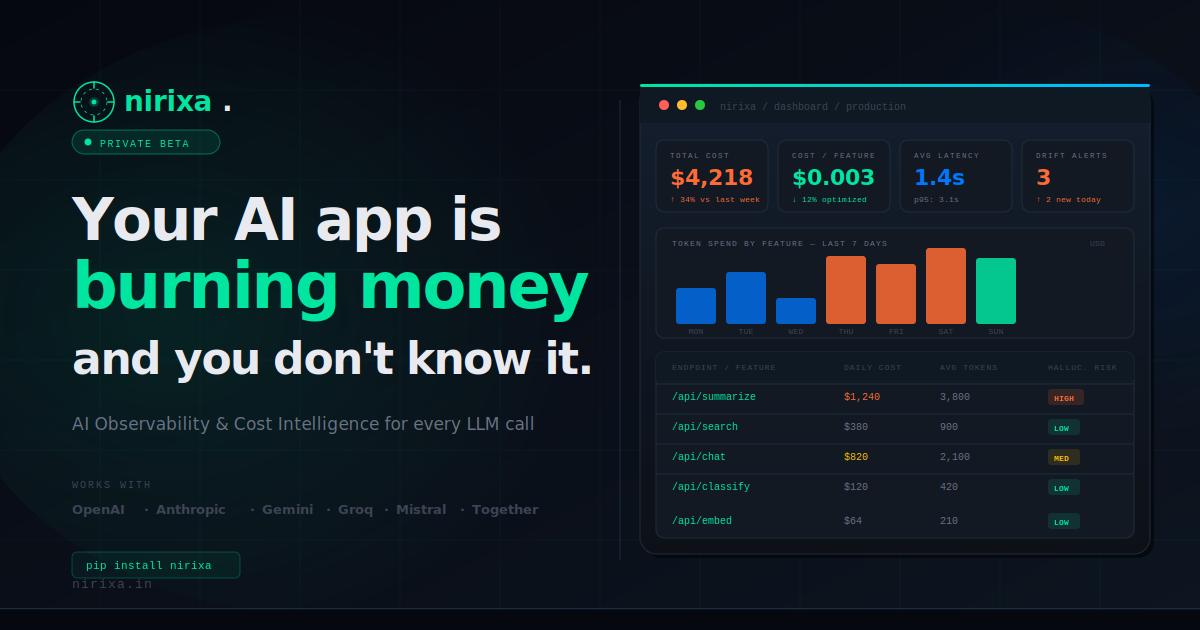
What is Nirixa?
Nirixa is an AI observability and cost intelligence solution for teams building with large language models. It is designed to help you track and understand each LLM call’s tokens, cost, and latency, and to assess hallucination risk.
The core purpose is to give developers and operators visibility into how model usage behaves in production, so they can monitor performance and manage spend across LLM providers.
Key Features
- Token and cost tracking per LLM call: records token usage and associated cost to make model spend attributable to specific requests.
- Latency visibility: captures timing information for each call so you can identify slowdowns and performance patterns.
- Hallucination risk detection: provides a way to estimate hallucination likelihood alongside other call metrics.
- Drop-in SDK for multiple LLM providers: supports integration with OpenAI, Anthropic, Gemini, and other providers through an SDK approach.
How to Use Nirixa
- Get started with Nirixa and add the provided drop-in SDK to your application where you make LLM requests.
- Configure it so requests are captured automatically for the supported providers.
- Use Nirixa’s call-level visibility to review tokens, cost, latency, and hallucination risk for your LLM traffic.
- Iterate on prompts or application logic based on the call metrics and risk signals you observe.
Use Cases
- Monitor production LLM traffic: track tokens, cost, and latency per request to understand how the system behaves under real usage.
- Control and investigate spend: identify which workflows or endpoints are driving the highest token usage and cost.
- Diagnose performance regressions: compare latency patterns across requests to spot slow model calls or problematic inputs.
- Reduce unreliable outputs: use hallucination risk estimates to find cases where generated responses may be less trustworthy, and adjust prompts or guardrails accordingly.
- Validate multi-provider behavior: when using OpenAI, Anthropic, Gemini (and more), compare call-level metrics across providers to understand differences in usage patterns.
FAQ
What does Nirixa measure for each LLM request? Nirixa focuses on token usage, cost, latency, and a hallucination risk signal for LLM calls.
Which model providers does Nirixa support? The page states that Nirixa provides a drop-in SDK for OpenAI, Anthropic, Gemini, and more.
Do I need to rewrite my LLM code to use Nirixa? The site describes Nirixa as a “drop-in SDK,” which implies you can integrate it without major rewrites, but exact steps depend on your current LLM client and how you call it.
Is Nirixa only for observability or also for cost management? It’s positioned as both AI observability and cost intelligence, combining cost tracking with performance and quality-related signals.
Alternatives
- General monitoring/telemetry platforms (APM/logging): suited for tracking service-level metrics, but they typically do not provide LLM-specific call details like tokens, cost, and hallucination risk out of the box.
- LLM usage dashboards built into orchestration frameworks: may offer token/cost visibility within a specific framework, but may not generalize across providers or offer the same hallucination-risk perspective.
- Model observability tools focused on prompt/response logging: can help debug outputs and monitor generation behavior, but may emphasize traceability over cost intelligence or standardized call-level metrics across providers.
Alternatives
BenchSpan
BenchSpan runs AI agent benchmarks in parallel, captures scores and failures in run history, and uses commit-tagged executions to improve reproducibility.
PromptScout
PromptScout tracks how your brand is mentioned, which competitors are recommended, and what sources are cited in AI answers—plus website audits.
Sleek Analytics
Lightweight, privacy-friendly analytics with real-time visitor tracking—see where visitors come from, what they view, and how long they stay.
MacSpoof
MacSpoof is a macOS MAC address changer that lets you change or randomize your Wi‑Fi MAC to reconnect and limit device logging on public Wi‑Fi.
ClawTick
ClawTick is a CLI-first AI agent automation platform for scheduling webhook tasks on cron with monitoring, alerts, retries, and execution logs.
OpenFlags
OpenFlags is an open source, self-hosted feature flag system with a control plane and typed SDKs for progressive delivery and safe rollouts.