

Raindrop
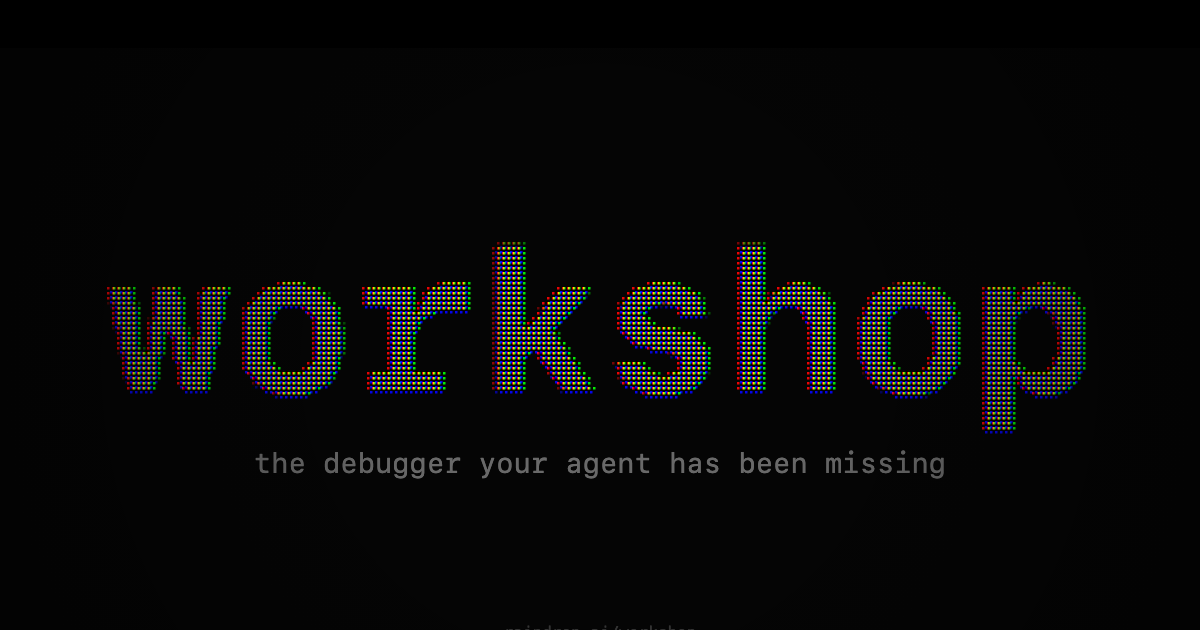
Raindrop’s Workshop is a local debugger for AI agents, streaming real-time execution traces. Integrated with Claude Code for agent evals.
What is Raindrop?
Raindrop’s Workshop is a local debugger for AI agents, designed to help you observe agent behavior and validate it with agent evals. It streams what your agent is doing in real time, including tokens and tool calls, so you can see decisions as they happen while your agent runs on localhost.
The workflow centers on Claude Code: Workshop records traces from agent execution, then Claude Code can write and run evaluation tests against those behaviors—optionally in a self-healing loop where failures lead to code changes and re-runs until assertions pass.
Key Features
- Live streamed agent traces on localhost: See every token, tool call, and decision as the agent runs, streamed into Workshop without polling or page refreshes.
- Trajectory + trace viewing for debugging: The interface shows traces such as “Overview,” “Span Tree,” and “Comms,” helping you inspect how the agent reasoned and what tools it invoked.
- Integrates with Claude Code: Claude Code reads Workshop traces to generate agent evals and update code based on evaluation outcomes.
- Evals that can be re-run and iterated: Workshop supports an eval workflow where tests are written, run, and verified (e.g., assertions about follow-up questions or behavior), with re-execution after fixes.
- Works alongside common agent/coding ecosystems: The page lists compatibility with Vercel AI SDK, OpenAI SDK, Anthropic SDK, LangChain, LlamaIndex, CrewAI, Mastra, and related tooling such as the Claude Code CLI and editors/agents like Cursor and OpenCode.
How to Use Raindrop
- Install Workshop using the provided script:
curl -fsSL https://raindrop.sh/install | bash - Start Workshop locally and run your agent so it connects to the local server (the page shows a
localhost:5899endpoint). - Open Workshop to watch traces stream in as your agent runs.
- Use Claude Code to write and run evals based on the trace data. When an eval fails, Claude Code can make changes and re-run the agent until the assertions pass (as demonstrated in the streamed example).
Use Cases
- Debug an agent that skips required follow-ups: Record a trace, run an eval that asserts follow-up questions are asked, then use Claude Code to update prompts or logic so the eval passes.
- Validate tool-calling behavior over multiple sessions: Compare how an agent behaves across different runs (for example, multiple “agent sessions” shown in the trace list) to confirm consistency.
- Create targeted regression checks for agent prompts: Use eval tests (e.g., checks for “doesn’t jump to diagnosis”) to ensure prompt changes don’t reintroduce previously fixed issues.
- Inspect execution comms and span structure: Review “Comms” and “Span Tree” views to understand what the agent did before a failure and which tool calls occurred.
- Support multi-framework agent development: Use Workshop while building agents with SDKs and frameworks listed on the page (e.g., LangChain/LlamaIndex/CrewAI), keeping debugging local while still running the agent stack you already use.
FAQ
-
Is Workshop only for Claude Code? The page emphasizes Claude Code integration: Claude Code reads traces and writes/runs evals. Workshop itself is positioned as the local debugger; the eval-writing loop is described specifically with Claude Code.
-
What does “live streamed traces” mean? The page describes streaming “every token, every tool call, every decision” into Workshop without polling or refreshing, using a local
localhost:5899connection. -
Which programming languages or frameworks are supported? The page lists compatibility with TypeScript and Python, and also references Rust and Go, along with Vercel AI SDK, OpenAI SDK, Anthropic SDK, LangChain, LlamaIndex, CrewAI, and Mastra.
-
How do agent evals work in Workshop? In the example shown, traces are used to generate eval tests (assertions), the tests are run, and failures trigger code fixes followed by re-running the agent until assertions pass.
Alternatives
- Local logging + test harness for agent runs: Instead of a trace viewer and integrated eval loop, you can build your own instrumentation to log tool calls/tokens and run unit/integration tests around agent outputs.
- Other AI agent observability tools: Category alternatives include tools focused on monitoring agent runs and visualizing traces; they may differ by whether they support an integrated eval-writing and iteration loop.
- Framework-native debugging: If you use a specific stack (e.g., LangChain/LlamaIndex), you can rely on their built-in tracing/logging and create eval scripts separately, rather than using Workshop as a dedicated local debugger.
Alternatives

Codex Plugins
Use Codex Plugins to bundle skills, app integrations, and MCP servers into reusable workflows—extending Codex access to tools like Gmail, Drive, and Slack.

ClawTick
ClawTick is a CLI-first AI agent automation platform for scheduling webhook tasks on cron with monitoring, alerts, retries, and execution logs.

Falconer
Falconer is a self-updating knowledge platform for high-speed teams to write, share, and find reliable internal documentation and code context in one place.
OpenFlags
OpenFlags is an open source, self-hosted feature flag system with a control plane and typed SDKs for progressive delivery and safe rollouts.

AakarDev AI
AakarDev AI is a powerful platform that simplifies the development of AI applications with seamless vector database integration, enabling rapid deployment and scalability.

Whirr
Whirr is a quiet macOS menu bar app that mirrors Claude Code agent activity to your Mac’s notch—so you can glance without watching the screen.