rtcStats
rtcStats is a SaaS that turns WebRTC peer-connection stats into structured observations and deductions to debug and improve WebRTC apps.
What is rtcStats?
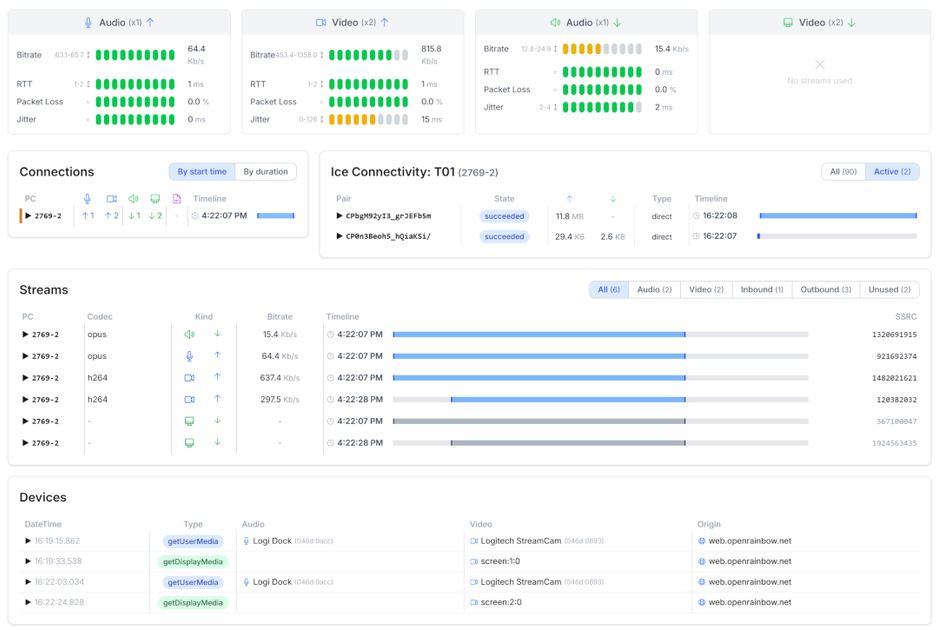
rtcStats is a SaaS service that helps you troubleshoot and improve WebRTC applications by turning WebRTC stats into structured insights. It processes raw measurements from WebRTC peer connections and outputs observations and deductions intended to identify likely root causes.
The core workflow is built around taking metrics collected via an open source rtcstats SDK, then performing calculations and aggregations to produce findings you can review. Instead of manually inspecting low-level stat values, rtcStats focuses on derived insights designed to speed up debugging.
Key Features
- Collect raw WebRTC metrics via the rtcstats SDK: You gather measurements using the open source rtcstats-server/SDK, which serves as the input for rtcStats processing.
- Foundations for direct WebRTC API metrics: The system starts from raw metrics collected via WebRTC APIs so downstream results are based on the underlying data.
- Statistical calculations on metric series: It performs computations such as average, max, and min over metric series to summarize behavior.
- Derived calculations from simple math: It computes additional metrics using basic divide and sum operations to create secondary signals.
- Observations and deductions outputs: It produces “observations” (patterns found across one or more metrics) and “deductions” (root-cause style conclusions and suggested solutions).
- API access to automate monitoring workflows: Paid accounts provide an API so you can collect the observations and deductions, store them in your own database, and use them in additional analysis.
- UI embedding via iframe (corporate plan): You can embed the rtcStats UI inside your own dashboards by using an iframe.
- Privacy controls described for rtcstats-server and deployments: The open source rtcstats-server can anonymize data by obfuscating IP addresses; enterprise options can include short-term storage provided by you, and there’s also an on-premise installation path via contact.
How to Use rtcStats
- Sign up for rtcstats.com and start with the free tier (no credit card required per the page).
- Collect WebRTC stats with the open source rtcstats SDK in your environment so rtcStats has the raw measurements it needs.
- Review observations and deductions produced from those metrics to understand what happened in your WebRTC peer connections.
- If you need automation or dashboard integration, use the API (paid accounts) to ingest observations/deductions into your own systems, and/or embed the UI in your dashboards using the provided iframe option (corporate plan).
Use Cases
- Debugging connection issues across multiple peer connections: When you suspect a problem during call setup or media exchange, you can review observations across one or more metrics to find what stands out.
- Finding probable root causes from metric patterns: After raw stats are collected, rtcStats performs aggregations and derived calculations to support deductions about likely causes and suggested next steps.
- Building a monitoring workflow for recurring WebRTC incidents: With the API, you can automate ingestion of rtcStats observations/deductions into your own database and trigger further analysis at scale.
- Consolidating WebRTC analysis in existing dashboards: If your team already uses dashboards for operational workflows, embedding the rtcStats UI as an iframe reduces context switching.
- Handling privacy constraints for user traffic: If you have concerns about what data is shared, the page describes options such as IP obfuscation in rtcstats-server, short-term storage approaches in enterprise setups, or on-premise installation.
FAQ
Is there a free version? Yes. You can sign up for rtcstats.com and use the free tier as long as you wish. The page indicates you can upgrade later for full benefits.
What do I get with a paid account? Paid plans add access to Observations and Deductions, more processing credits, and the ability to use an API and embed the UI in your own dashboards.
Do you provide an API for observations and deductions? Yes. The API can be used to automate monitoring and debugging workflows by collecting rtcStats observations and deductions, storing them where you choose, and performing further analysis.
Can I embed the rtcStats UI in my own application? Yes. The page states that the corporate plan enables embedding the rtcStats UI as an iframe in your dashboards.
How does rtcStats handle privacy if I don’t want to send user data? rtcstats.com is described as a SaaS service that must access data to generate deductions and observations. The page also outlines privacy protections including anonymizing via IP obfuscation in rtcstats-server, configurable short-term storage options for enterprise accounts, and an on-premise installation path upon request.
Alternatives
- In-house WebRTC metrics logging and custom dashboards: You can build your own pipeline that collects WebRTC stats and computes aggregations manually. This is more hands-on, with fewer prebuilt “observations/deductions.”
- Open-source WebRTC stats analysis tools: Alternative approaches are to use open-source tooling for WebRTC stats collection and then write your own analysis logic. This may require more engineering to reach similar inference-style outputs.
- Generic application monitoring platforms with WebRTC-specific instrumentation: Some monitoring stacks can ingest custom metrics and alerts, but you may need to implement the WebRTC-specific interpretation layer (instead of using rtcStats’ observations/deductions processing).
Alternatives
skills-janitor
Audit, track usage, and compare your Claude Code skills with skills-janitor—nine focused slash commands and zero dependencies.
Rectify
Rectify is an all-in-one operations platform for SaaS, combining monitoring, analytics, support, roadmaps, changelogs, and agent management—via conversation.
PromptScout
PromptScout tracks how your brand is mentioned, which competitors are recommended, and what sources are cited in AI answers—plus website audits.
SaveMRR
SaveMRR scans Stripe billing data to find SaaS MRR leaks and help recover failed payments, save cancellations, and win back churn—60-sec Free Revenue Scan.
Sleek Analytics
Lightweight, privacy-friendly analytics with real-time visitor tracking—see where visitors come from, what they view, and how long they stay.
Struere
Struere is an AI-native operational system that replaces spreadsheet workflows with structured software—dashboards, alerts, and automations.