Universal component system
Build diagrams from 7 universal component types: Person, Step, Storage, Decision, Trigger, Tool, and Channel. The small set is intended to stay composable while keeping the canvas readable.
Chinilla is a browser-based system design simulator for building and testing architectures on a canvas. Spot bottlenecks, queueing, and failure modes before code.
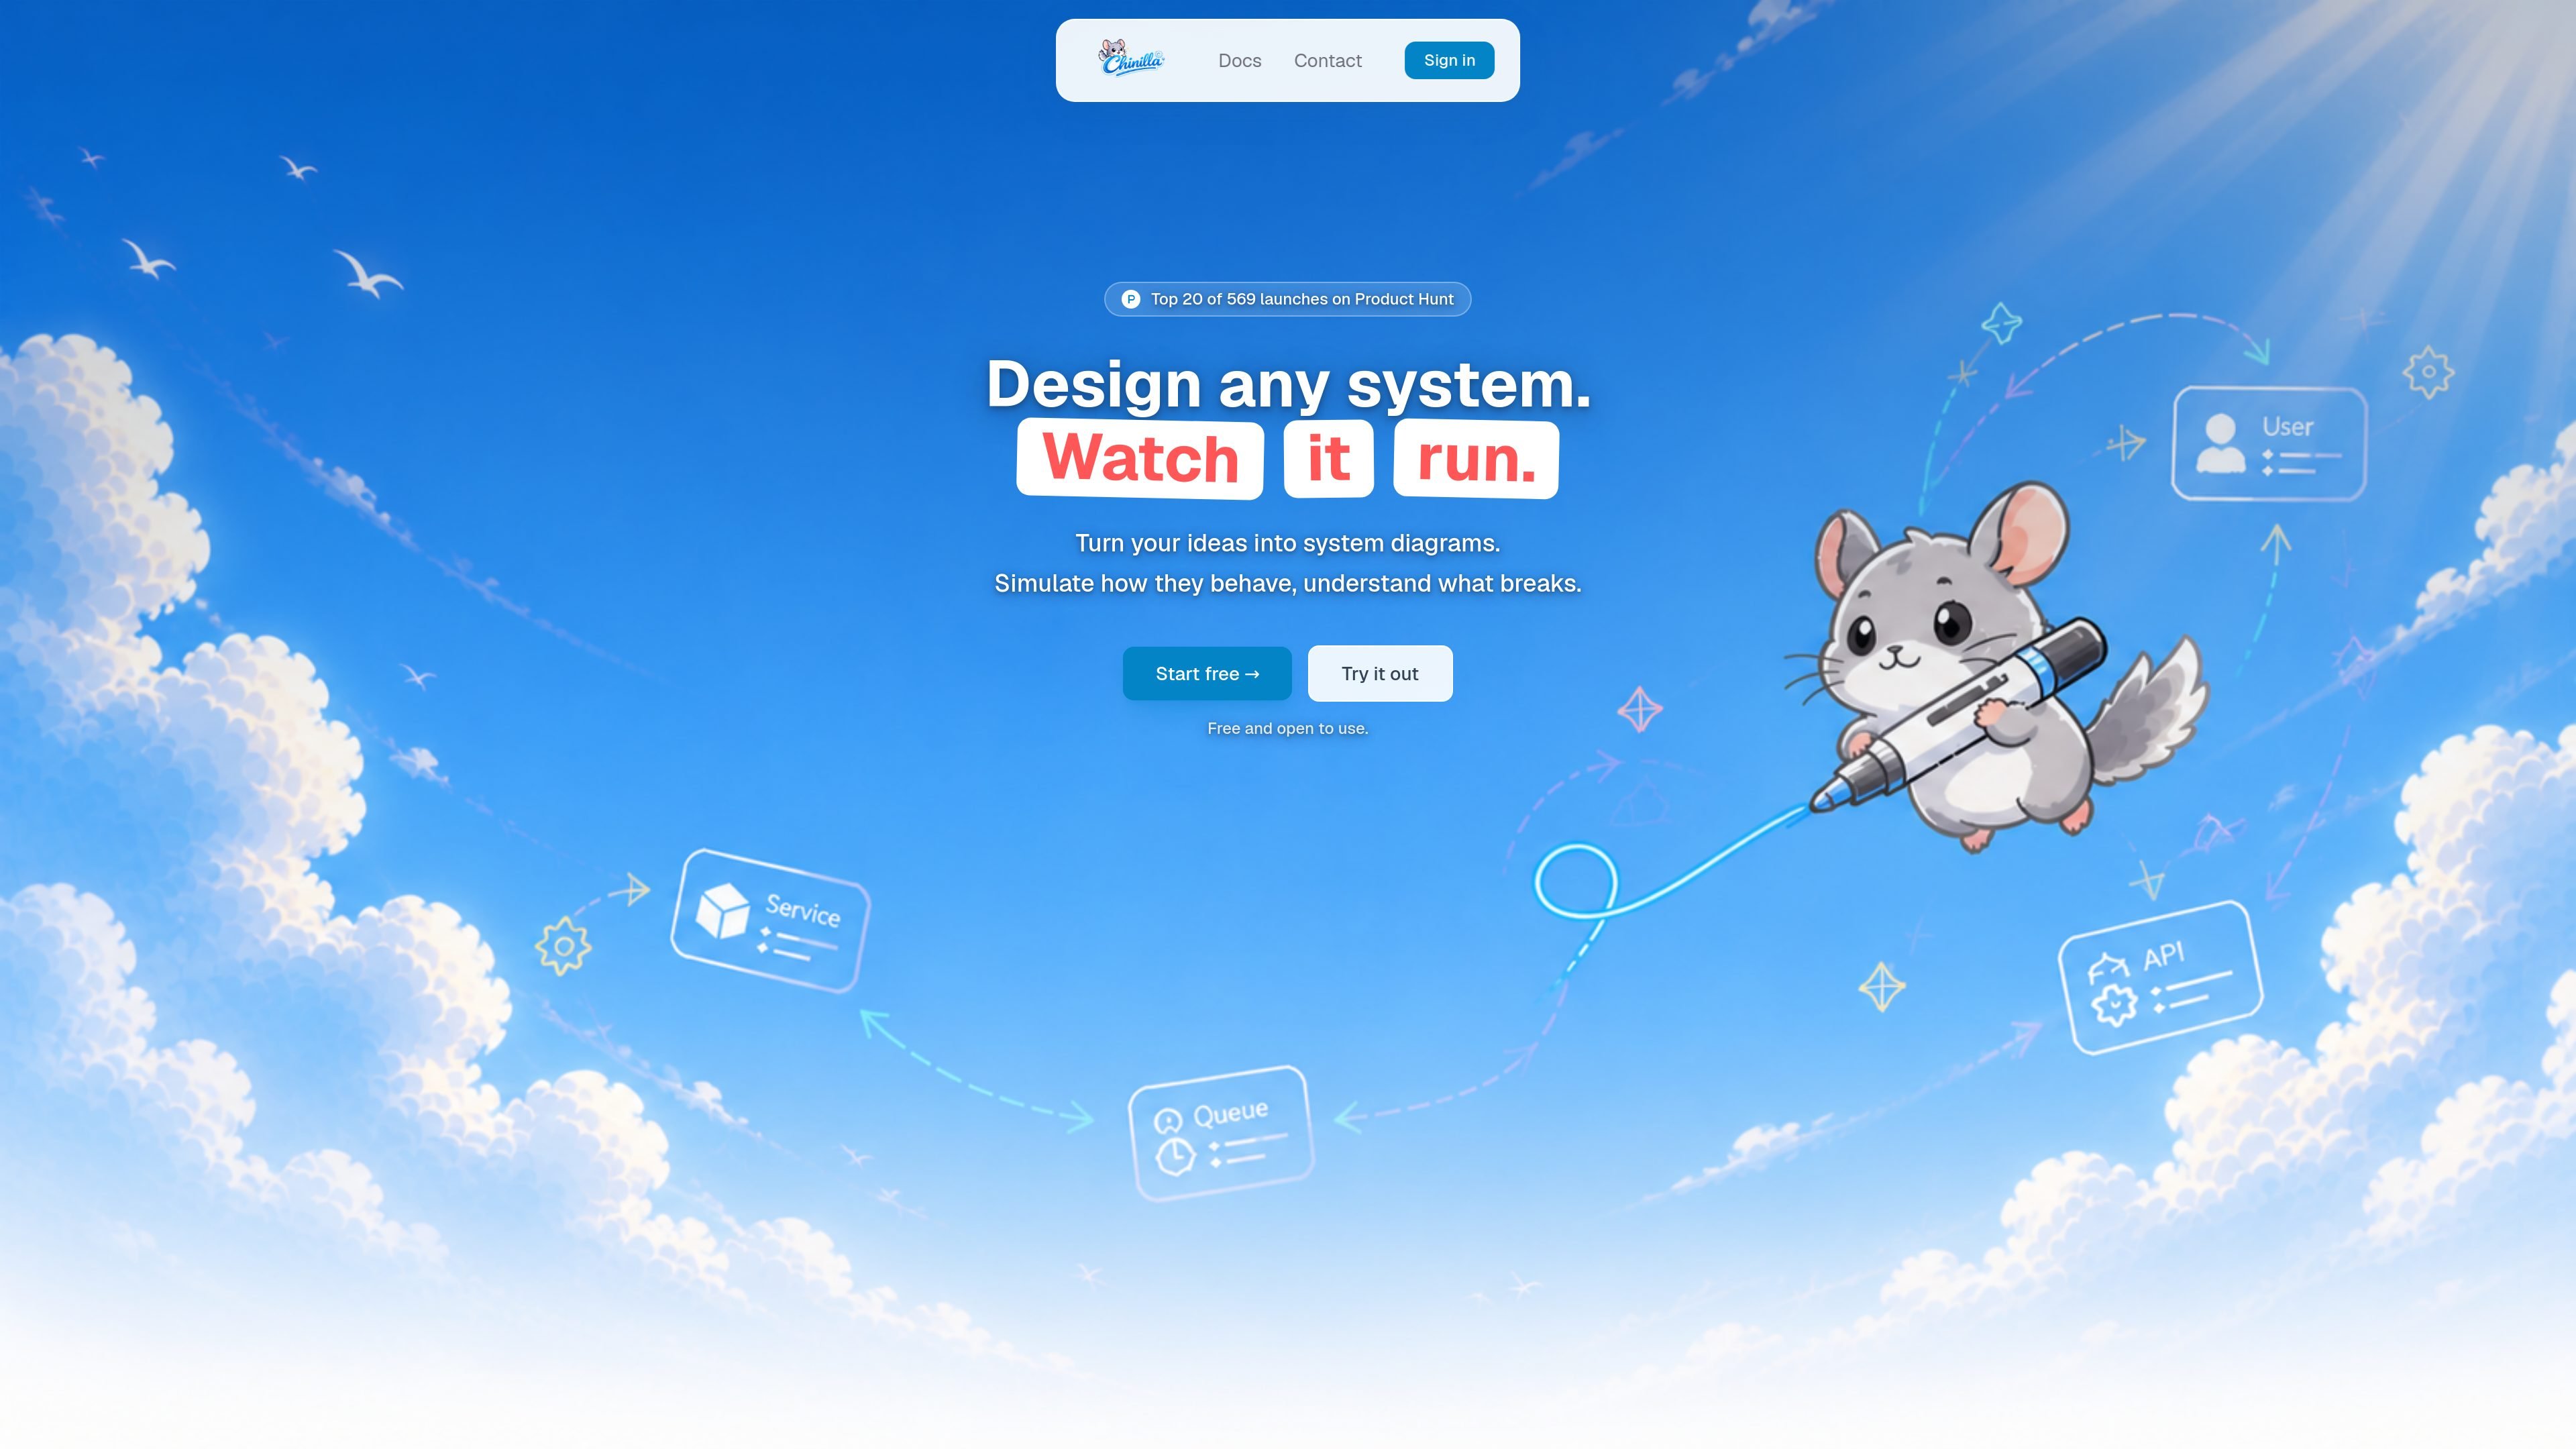
Chinilla is a browser-based system design simulator for mapping workflows, architectures, and other systems with moving parts. Users place components on a canvas, wire them together, and run a deterministic simulation to see how packets flow, where queues build, and where the design breaks under load.
The product is aimed at system design interview prep, architecture brainstorming, teaching, and early-stage validation before code is written. It also supports AI-assisted refinement, collaborative editing, and repository-to-diagram workflows for bringing existing projects into the canvas.
Build diagrams from 7 universal component types: Person, Step, Storage, Decision, Trigger, Tool, and Channel. The small set is intended to stay composable while keeping the canvas readable.
Connect nodes with behaviors such as passthrough, filter, split, delay, retry, circuit breaker, batch, and replicate. Queueing is also universal when a component has capacity set.
Run a deterministic discrete-event simulation that pushes packets through the graph step by step. Same inputs and same seed produce the same result, which makes comparisons repeatable.
Inspect where designs stall under load, including queue growth, overflow, drop rates, retry counts, rate-limit drops, and circuit-breaker trips. The runtime is meant to surface bottlenecks before implementation.
Work on a shared canvas with live cursors, use interview mode for a mock round, and follow built-in rubrics. The site also describes one-on-one sessions with an owner and one guest as a Pro feature.
Import from a GitHub repo or URL, then export results as PNG, SVG, Mermaid, animated GIF on Pro, or a one-click markdown System Spec. You can also publish a live link and embed the diagram in docs or a README.
Load a system design prompt, build the architecture on the canvas, and run the simulator to see whether throughput, queueing, or failure behavior holds up under pressure.
Sketch microservices, workflows, or service dependencies before implementation to reason about capacity, bottlenecks, retries, and failure modes.
Use the canvas in lessons, docs, or guided demos to show how queues, delays, circuit breakers, and branching affect a system over time.
Import an existing repository into Chinilla, turn it into a runnable diagram, and publish or embed the result for others to review.
Open interview mode with a built-in rubric for a mock round, then use the shared canvas and live cursors for collaborative sessions.
Chinilla is a browser-based system design simulator. It is meant for architecture brainstorming, interview prep, teaching, and stress-testing designs before writing code.
The source describes Chinilla as a browser-based product, so the workflow runs in the browser rather than as a desktop install.
Chinilla’s pricing page shows a Free plan and a Pro plan at $20/month. The site also says the free version is available without a credit card.
The site says Pro adds AI design and GitHub repo-to-diagram support. It also offers publishing, embedding, and export options such as PNG, SVG, Mermaid, and a markdown system spec.
Chinilla is not positioned as a production load tester, observability tool, Kubernetes view, or wire-level network simulator. The site also says it does not model network jitter distributions, GC pauses, or kernel scheduling.
HTTPie AI is an upcoming AI-powered API interaction tool from HTTPie, with Chat coming soon for a new way to work with APIs.
ClawTick is an AI agent automation platform for scheduling jobs from the CLI, dashboard, or REST API. Built for developers and teams using LangChain, CrewAI, webhooks, or custom workflows with monitoring, alerts, and logs.
Falconer is an AI-powered company brain that keeps internal docs accurate, searchable, and up to date by syncing with GitHub, Slack, and Linear.
OpenFlags is an open-source, self-hosted feature flag platform for JavaScript teams, with local evaluation, targeted rollouts, and controlled launches.
Speculos deploys Claude Code apps to shareable URLs, with private, org-wide or public visibility and team controls for domains, data and cloud deployments.
Skills Janitor is a GitHub-hosted set of slash commands for auditing, tracking, and cleaning up Claude Code and OpenAI Codex skills.