ClawTrace
ClawTrace provides observability for OpenClaw agents, showing failed runs, step cost spikes, and live insights via the OpenClaw Doctor agent.
What is ClawTrace?
ClawTrace provides observability for OpenClaw agents. It helps you understand what happened during agent runs—what failed, where costs increased, and what to change next—so you can improve reliability and reduce spending.
The product combines run-level views and detailed traces of LLM calls, tool usage, and sub-agent delegation. It also includes “Tracy,” an interactive agent that analyzes live run data and provides context-aware recommendations.
Key Features
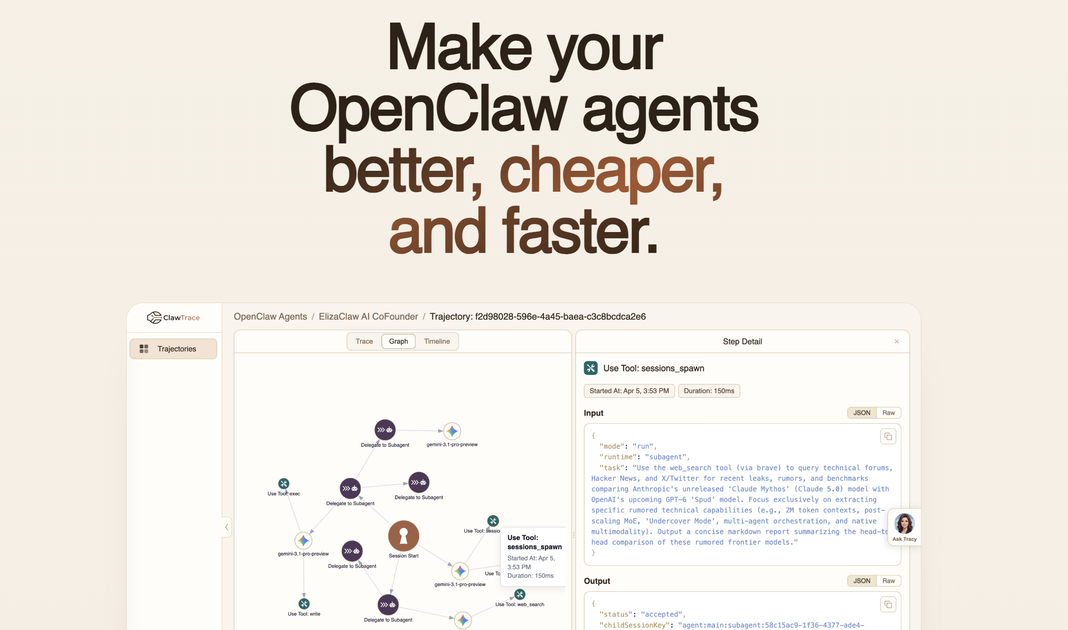
- Interactive execution tracing (trace tree with payloads): Inspect every LLM call, tool use, and sub-agent delegation within a run to pinpoint where things went wrong.
- Cost visibility by run and step: See how spend changes across an agent run and drill into step-level cost spikes to identify where budgets leak.
- Failure diagnostics and likely root cause surfacing: Trace unstable behavior and highlight the likely causes alongside suggested actions to improve.
- Graph-level relationship mapping (call graph): Visualize how agents, tools, and models relate across the full trajectory.
- Timeline bottleneck and parallelism view: Use a Gantt-chart-style timeline to spot bottlenecks and understand parallelism across steps.
- Trajectory dashboards for monitoring: View all trajectories with metrics, daily trends, token usage, and run-level drilldown.
- “Tracy” doctor agent for guided analysis: Ask why a run failed, where a bottleneck is, or how to reduce costs; Tracy adapts to the page/context you’re viewing.
- Live data responses: Answers are generated from live data rather than stale dashboards or delayed reporting.
- Conversation follow-ups: Tracy remembers the conversation and can dig deeper with follow-up questions.
How to Use ClawTrace
- Install the ClawTrace plugin on your OpenClaw agent:
openclaw plugins install @epsilla/clawtrace. - Authenticate using your observe key:
openclaw clawtrace setup. - Restart the gateway:
openclaw gateway restart. - Run your agent as normal: trajectories stream to ClawTrace automatically, where you can inspect traces, spans, tokens, and costs in real time.
- Use Tracy for diagnosis and recommendations: Ask questions about failures, bottlenecks, or cost reduction, then follow up to refine the analysis.
Use Cases
- Debugging an unstable OpenClaw agent: When behavior becomes inconsistent, use execution traces and trace-tree navigation to find the likely root cause and view actions that can improve reliability.
- Investigating a cost spike: If costs rise unexpectedly, inspect spend by agent run and step to identify which steps drive increased token usage or spending.
- Eliminating inefficient looping: When agents loop back and forth, use the timeline and call graph to find where progress stalls and what part of the trajectory should be adjusted.
- Comparing improvements across changes: Use Tracy to evaluate a run after applying changes such as switching to cheaper models when possible or scripting repeatable steps to keep runs more stable.
- Operational monitoring across many trajectories: Use the trajectory dashboard to review daily trends, token usage, and run-level drilldowns to catch recurring issues across deployments.
FAQ
-
Does ClawTrace work with OpenClaw agents? Yes. The site describes ClawTrace specifically as “observability for OpenClaw agents,” including an installable plugin and trajectory streaming.
-
What does Tracy analyze? Tracy analyzes the run/trajectory context you’re viewing and answers questions about why a run failed, where bottlenecks are, and how to reduce costs. It uses live data.
-
How do traces and cost details appear in ClawTrace? ClawTrace provides an interactive trace tree with payloads for LLM calls, tool use, and sub-agent delegation, plus views for spend by agent run and step.
-
Do I need to set up the integration before using it? Yes. The basic workflow listed is installing the plugin, authenticating with an observe key, and restarting the OpenClaw gateway.
-
How is the data kept current? The site states that Tracy’s answers come from live data and that there are no stale dashboards or delayed reports.
Alternatives
- General-purpose LLM observability/telemetry tools: These can provide logs, traces, and token/cost metrics for LLM calls, but may not offer OpenClaw-specific trajectory views like call graph relationships and Tracy-style diagnosis.
- Open-source tracing frameworks for LLM workflows: If you already have a tracing pipeline, you may build custom dashboards and debugging views for agent steps and tool calls, but you’ll lose the turnkey “run failure → likely root cause → next fixes” workflow.
- Workflow monitoring and analytics dashboards: For teams focused on operational metrics (latency, throughput, error rates), analytics tools can help detect issues, but they may not provide step-level execution traces with payload visibility and interactive trajectory drilldown.
Alternatives
BenchSpan
BenchSpan runs AI agent benchmarks in parallel, captures scores and failures in run history, and uses commit-tagged executions to improve reproducibility.
PromptScout
PromptScout tracks how your brand is mentioned, which competitors are recommended, and what sources are cited in AI answers—plus website audits.
Sleek Analytics
Lightweight, privacy-friendly analytics with real-time visitor tracking—see where visitors come from, what they view, and how long they stay.
Codex Plugins
Use Codex Plugins to bundle skills, app integrations, and MCP servers into reusable workflows—extending Codex access to tools like Gmail, Drive, and Slack.
MacSpoof
MacSpoof is a macOS MAC address changer that lets you change or randomize your Wi‑Fi MAC to reconnect and limit device logging on public Wi‑Fi.
Wallie
Wallie is an open-source AI streamer framework with real-time vision, persona profiles, chat, TTS, and avatar output for VTuber-style streams.