GitCity
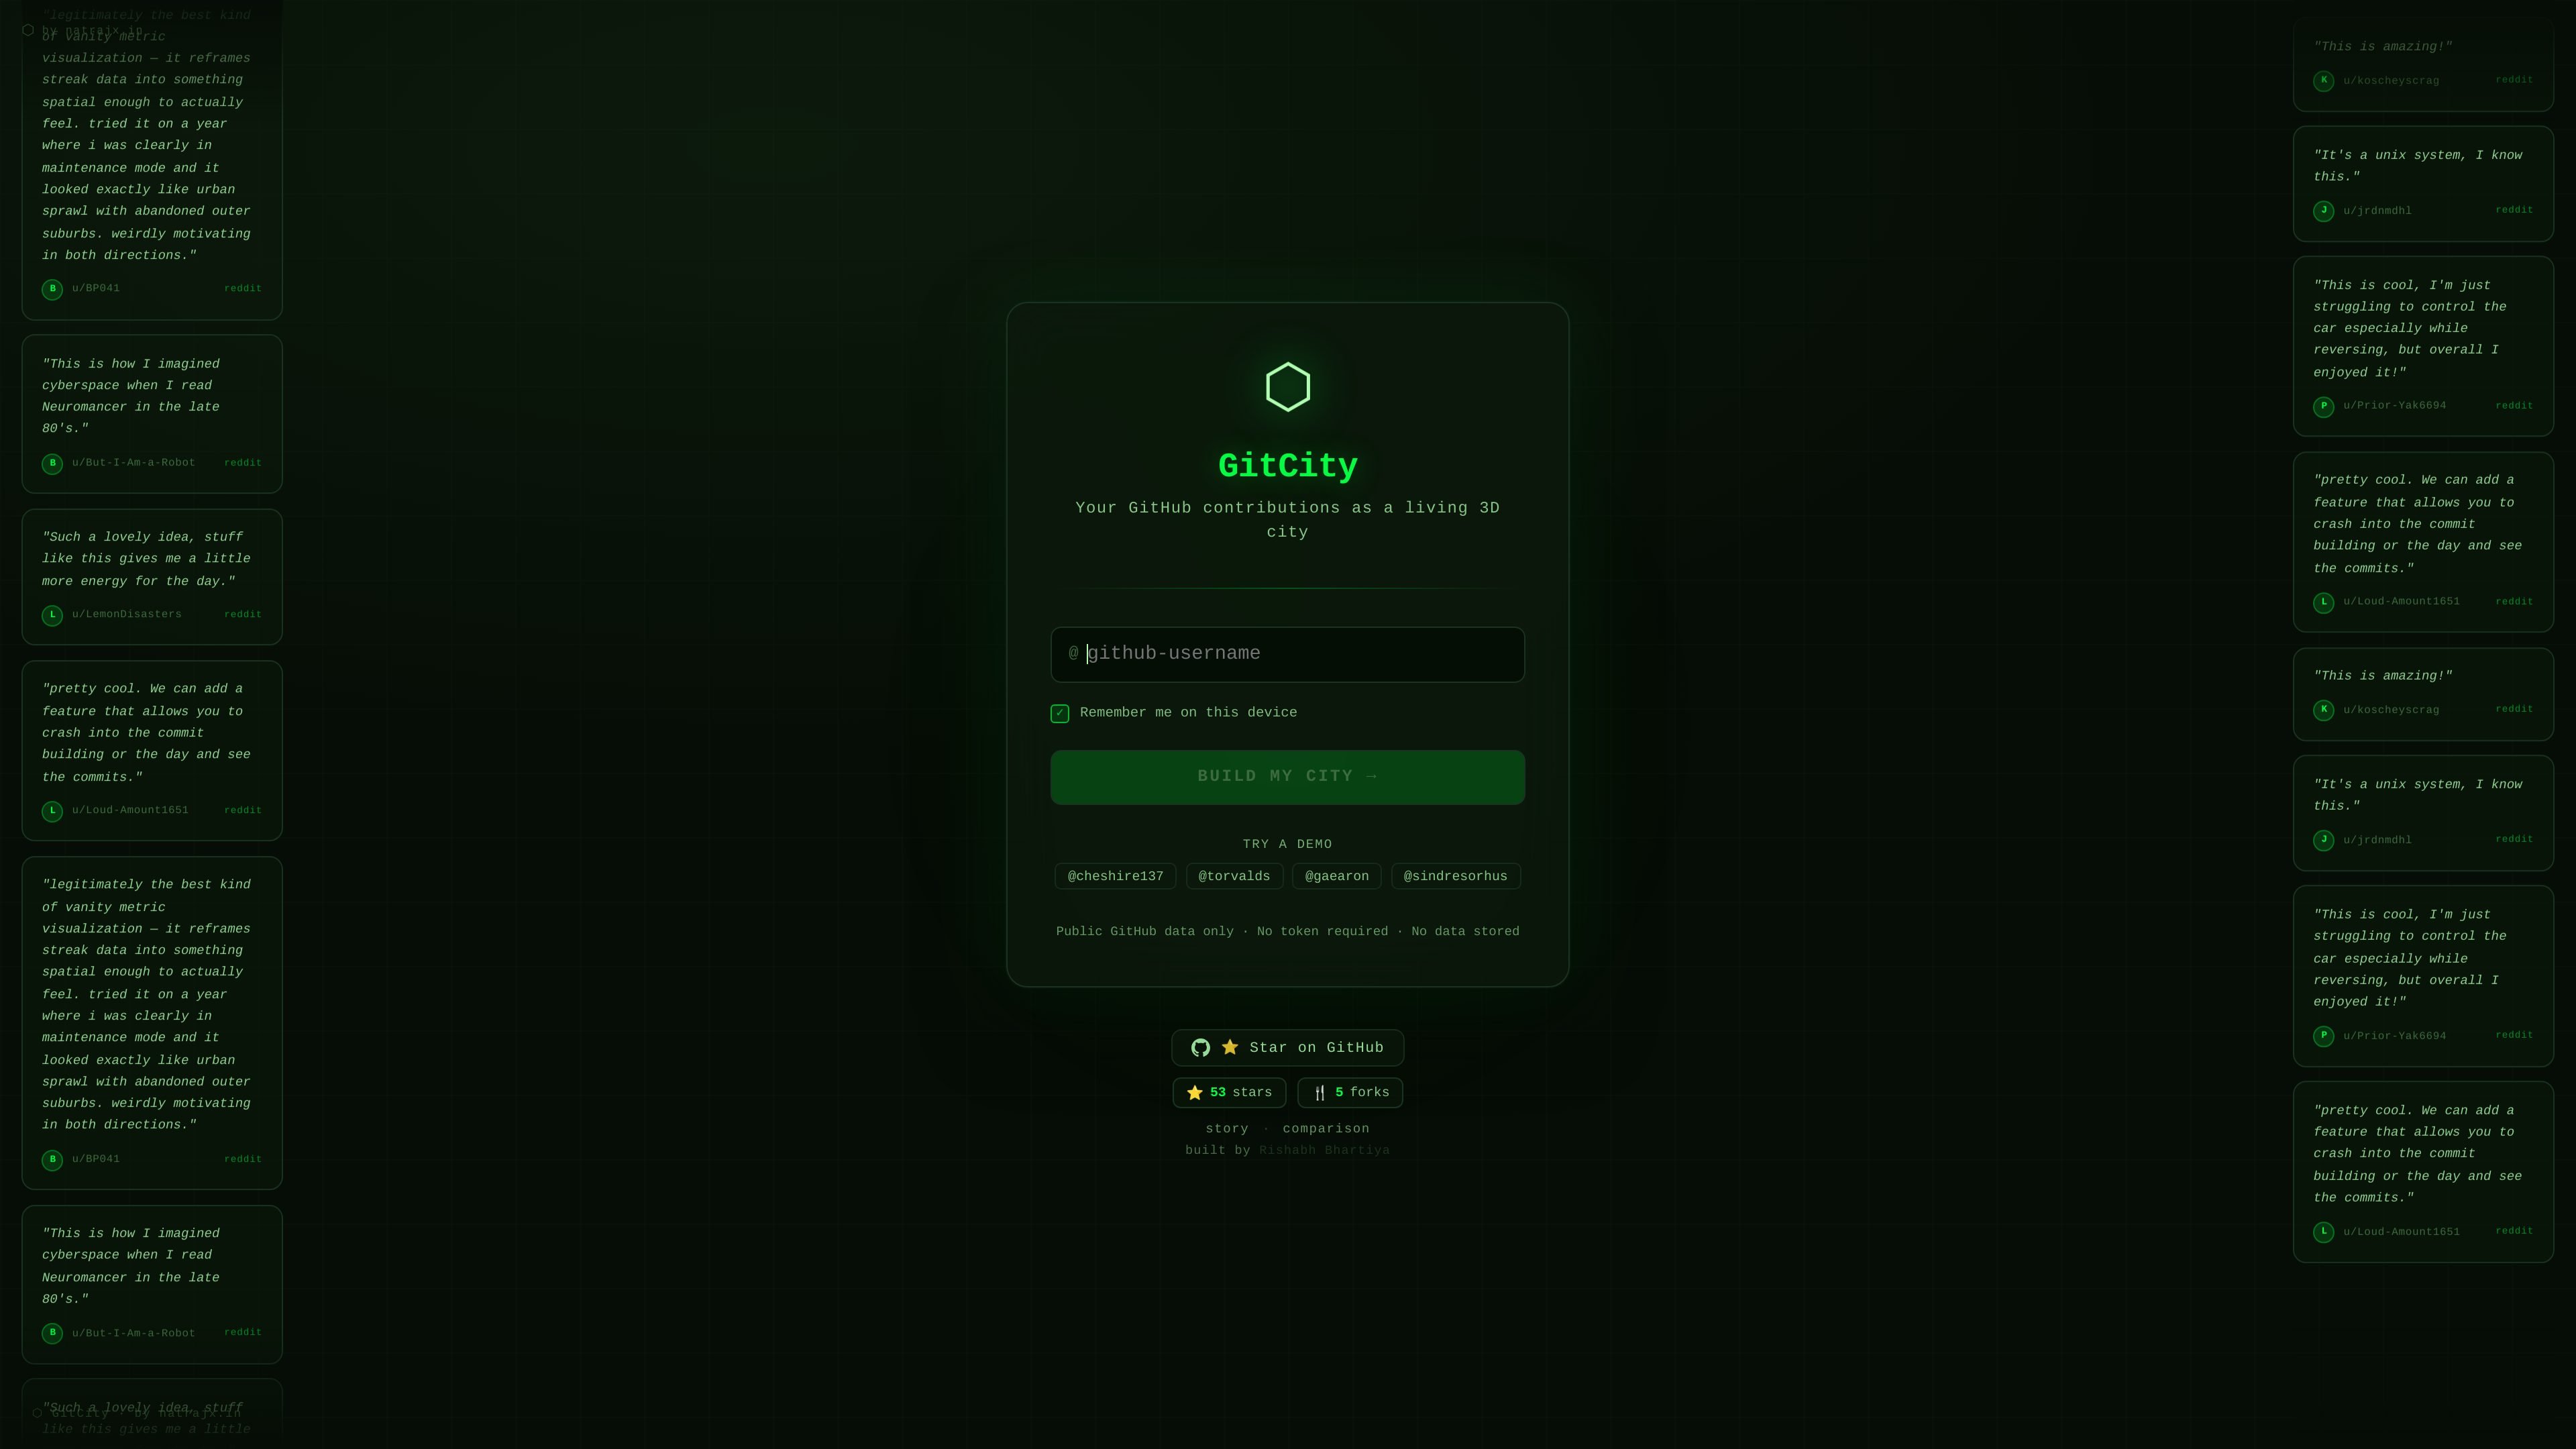
GitCity turns your public GitHub contribution history into an interactive isometric 3D city skyline, with an embeddable SVG for README and portfolios.
What is GitCity?
GitCity turns a user’s GitHub contribution history into an interactive isometric 3D city skyline. The core idea is that each day of public contributions becomes a “building,” with commit activity influencing the height, letting you explore your activity visually rather than as a grid.
It’s intended for GitHub users who want to present contribution data in a more engaging format—such as embedding an SVG in a README or developer portfolio—without manual setup beyond entering a GitHub username.
Key Features
- Interactive isometric 3D city from GitHub contributions: Builds a skyline based on public contribution activity so viewers can understand patterns at a glance.
- Driveable city simulation: Includes a simulation mode where you can navigate the city “from street level” to examine the skyline spatially.
- Theme switching (6 themes): Provides themed visuals including Matrix, Noir, Aurora, Ocean, Gold, and Ice to match different aesthetic preferences.
- Time filtering by year, month, or week: Lets you limit the visualization to specific time ranges rather than only showing a full history view.
- Embeddable SVG for GitHub README and portfolios: Produces an SVG embed so the visualization can be included on developer profiles and project pages.
- Zero configuration via GitHub username: Uses the entered username to fetch public contribution data automatically, reducing setup steps.
How to Use GitCity
- Open GitCity and enter your GitHub username.
- GitCity fetches your public contribution data and renders the city where days with commits appear as buildings.
- Use theme controls to change the look and filter controls to focus on a year, month, or week.
- If you want to share it, use the embeddable SVG option to generate an embed for your GitHub README or developer portfolio.
- (Optional) Switch to simulation mode and drive through the city to explore it from street level.
Use Cases
- Personal GitHub README visualization: Embed the generated SVG in a README to show contribution activity as a 3D skyline instead of a static chart.
- Portfolio presentation: Include the city visualization on a developer portfolio page to provide an at-a-glance view of coding activity.
- Time-scope review (monthly or weekly): Filter by month or week to review how contribution volume changes over shorter periods.
- Activity storytelling by aesthetics: Change themes (e.g., Noir or Aurora) when presenting your skyline in different contexts like project pages or social profiles.
- Exploratory “walkthrough” of contributions: Use simulation mode to navigate the city and visually interpret patterns in commitment density.
FAQ
-
What data does GitCity use? GitCity fetches public GitHub contribution data for the username you enter.
-
How does GitCity map commits to the 3D city? According to the page, each day with commits becomes a building, and the more commits, the taller the tower.
-
Can I limit the visualization to a specific time range? Yes. GitCity includes filters for year, month, or week.
-
Can I embed the visualization on other pages? Yes. GitCity offers an embeddable SVG intended for GitHub READMEs and developer portfolios.
-
Do I need to configure anything beyond my GitHub username? The page describes the setup as zero configuration aside from entering a GitHub username.
Alternatives
- GitHub contribution visualizations (2D heatmaps/charts): Instead of a 3D city and simulation, these alternatives typically present contributions as grids or charts; they’re simpler but less spatial.
- Portfolio/static GitHub stats widgets: Tools that generate badges or static summaries can be easier to embed, but they usually don’t offer the drive-through city experience or time-scoped 3D view described here.
- Custom visualization built from GitHub API data: A DIY approach can produce tailored visuals (including 3D), but it shifts setup and maintenance effort onto the user rather than using a zero-configuration workflow.
Alternatives
PXZ AI
An All-In-One AI Platform that combines tools for image, video, voice, writing, and chat to enhance creativity and collaboration.
Slidesgo
Discover free Google Slides themes and PowerPoint templates on Slidesgo. Download and customize online to create presentations.
Grok AI Assistant
Grok is a free AI assistant developed by xAI, engineered to prioritize truth and objectivity while offering advanced capabilities like real-time information access and image generation.
Decision Jar
Create virtual jars of options with Decision Jar—shake your phone to pick instantly, use AI suggestions, and view decision logs over time.
AakarDev AI
AakarDev AI is a powerful platform that simplifies the development of AI applications with seamless vector database integration, enabling rapid deployment and scalability.
AI Song Maker
Create royalty-free songs effortlessly with our AI Song Maker and Music Generator.