
Startup performance metrics
Track cold launch, warm launch, bundle load, first render, and time to interactive across real device sessions, with P50, P90, and P99 views for each metric.

EAS Observe monitors production performance in Expo and React Native apps, showing startup metrics, session timelines, release markers, and errors in the Expo dashboard.
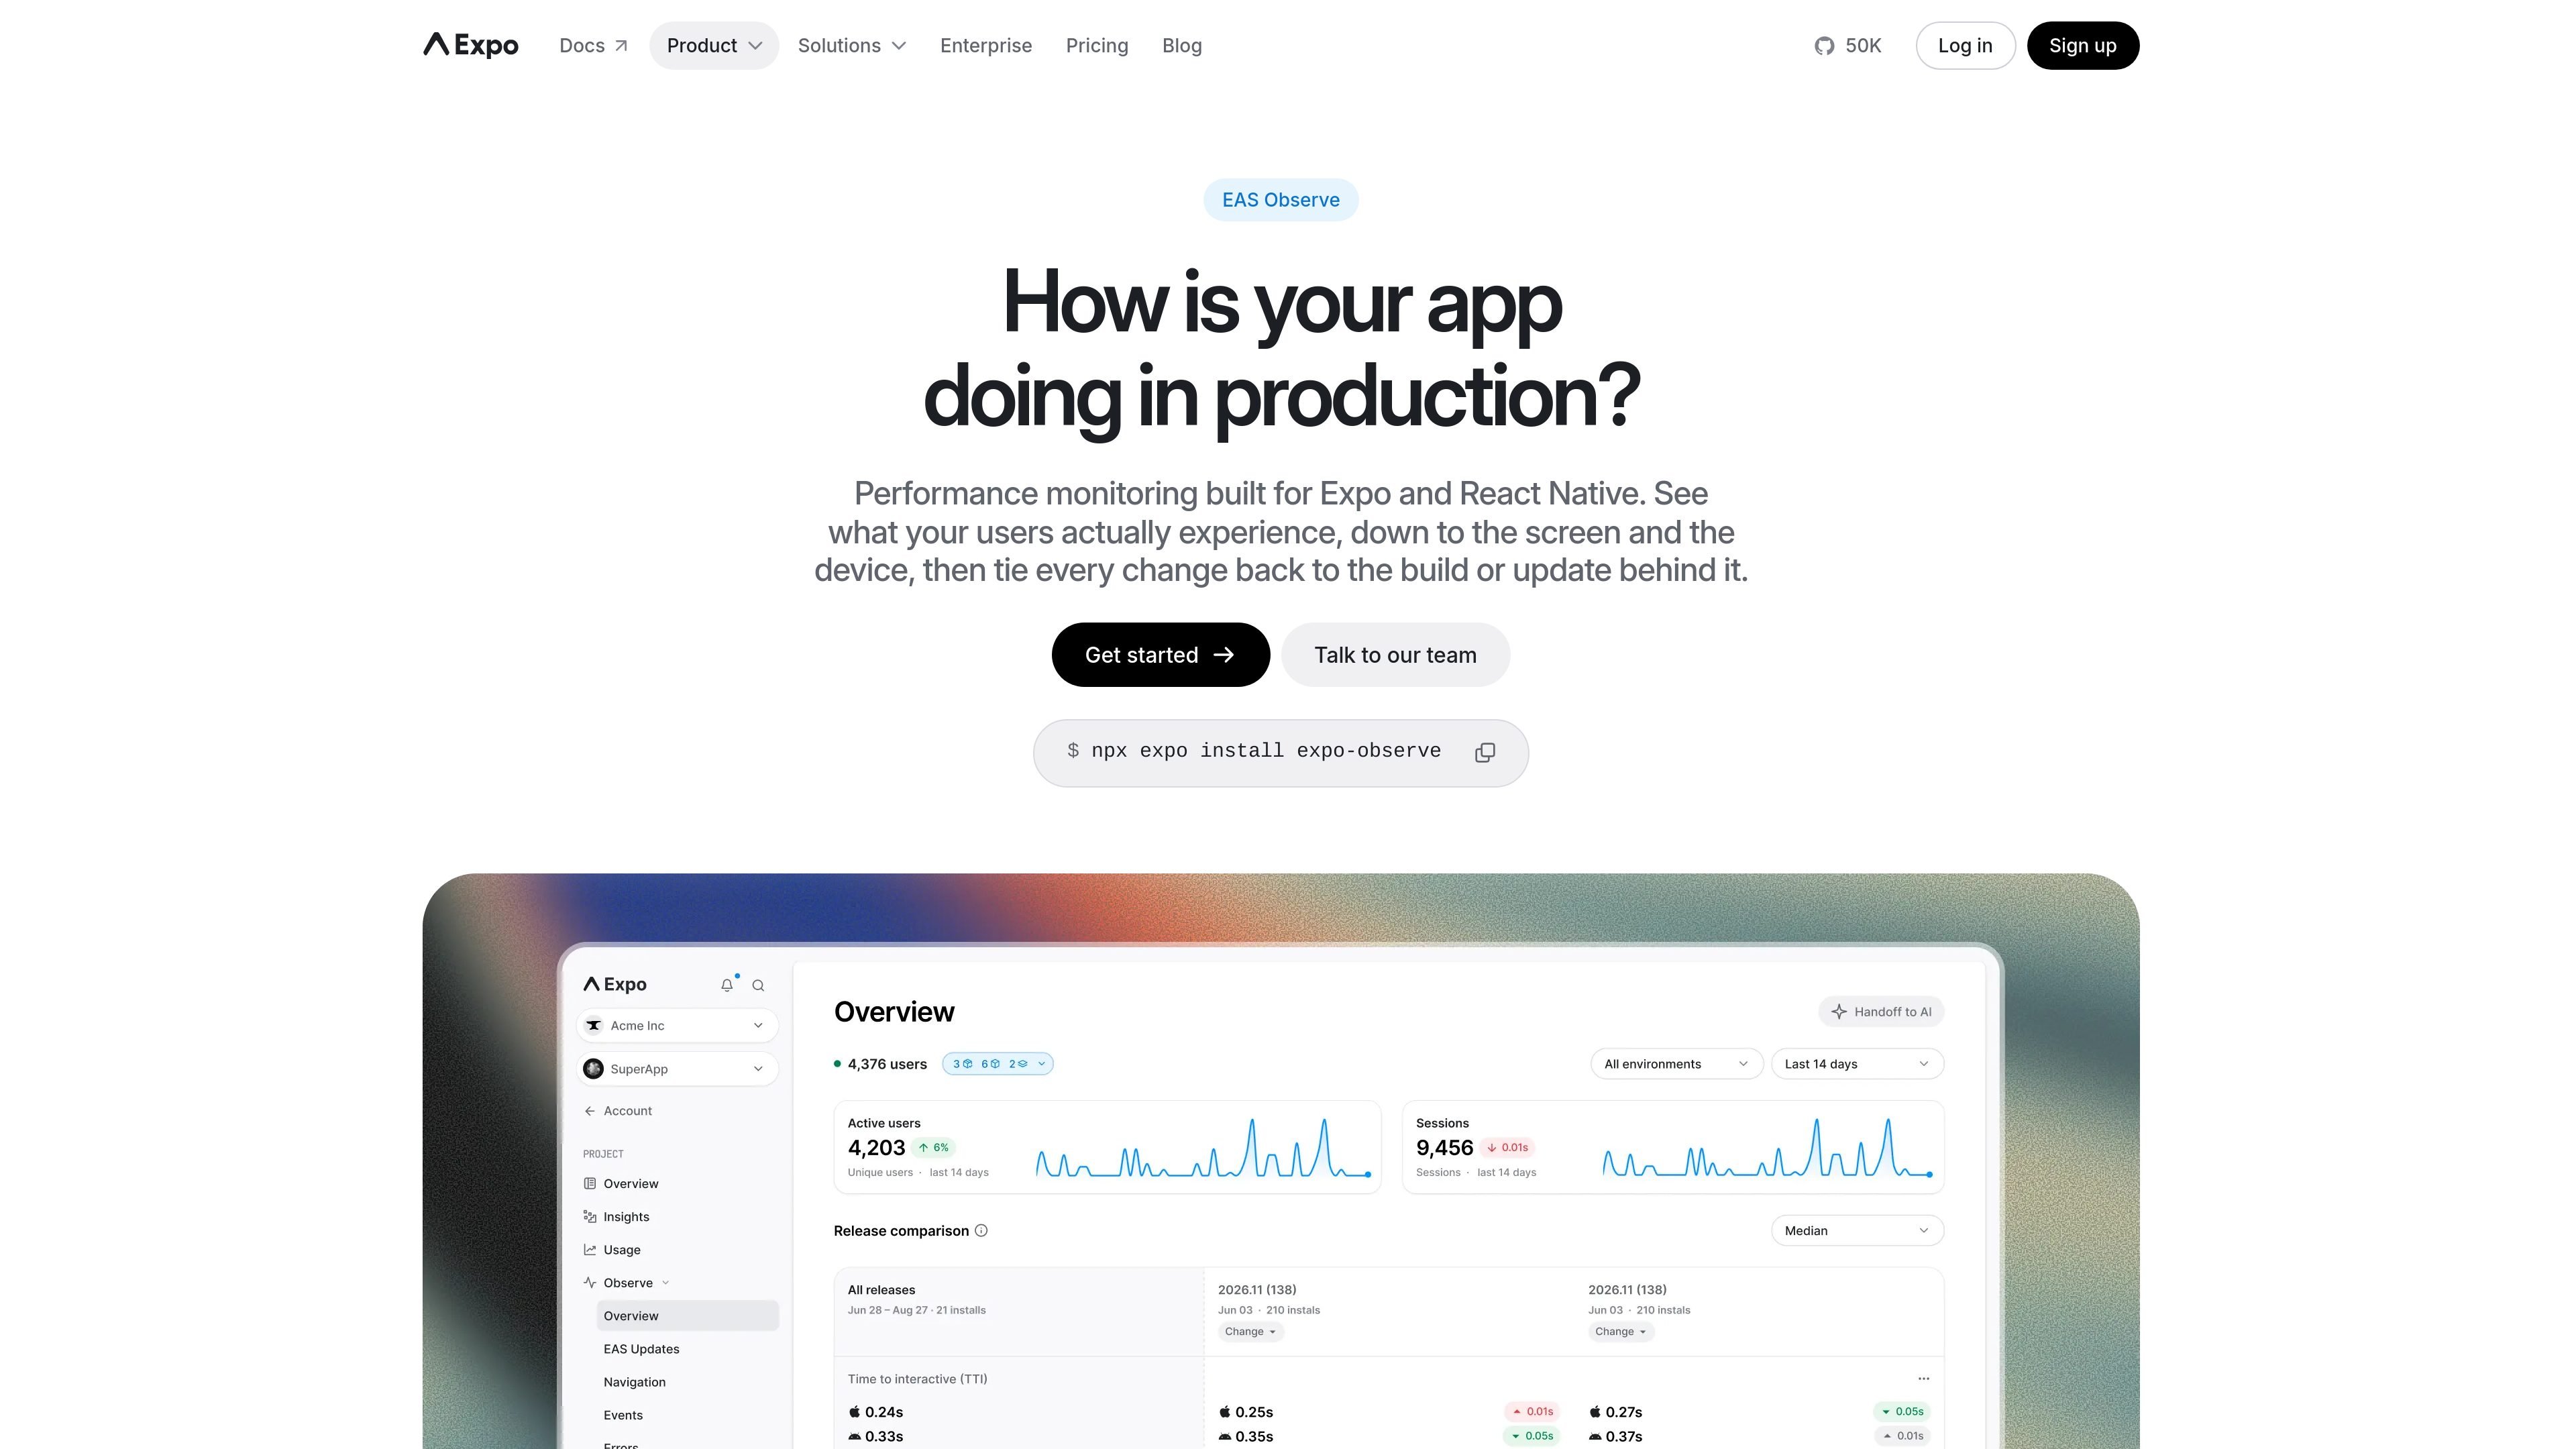
EAS Observe is a mobile performance monitoring service for Expo and React Native apps. It surfaces production metrics directly in the Expo dashboard and links those metrics back to the build or OTA update that introduced them.
The product is positioned for teams that want to understand real user experience on device, not just aggregate app health. It combines startup timing data, session timelines, release markers, and error traces so developers can investigate performance changes, route-level slowdowns, and crashes in one place.
Track cold launch, warm launch, bundle load, first render, and time to interactive across real device sessions, with P50, P90, and P99 views for each metric.
Follow one session through navigation, performance, and custom events so you can reconstruct what happened before a user converted, dropped off, or hit a failure.
Tie every build and OTA update to performance data, then compare a release against the version before it to see what changed after shipping.
See JavaScript errors with a stack trace that points to the file and line, rather than only a minified bundle location.
Break time to interactive down by route through Expo Router integration, helping you identify slow screens instead of relying on app-wide averages.
Inspect metrics, routes, events, and sessions from the CLI, and let an agent receive the same context directly from Observe.
Use Observe to watch cold and warm launches, bundle load, first render, and time to interactive on real devices, then inspect the distribution across your user base.
Use build and update markers to determine whether a slowdown, error spike, or changed user journey appeared after a specific release or OTA update.
Use route-level performance views and session timelines to find which screen or step is slow, then compare routes across builds or updates.
Use custom events and timeline views to trace checkout, onboarding, sync, or similar flows and see what happened before a user converted or failed.
Use CLI access or an agent workflow to pull metrics, routes, events, and sessions when you want the same context without manual dashboard copying.
Observe is built for Expo apps. The page says that if you’re on Expo SDK 55 or later and using EAS, you’re set; bare React Native support is described as being on the roadmap.
Yes. The page says you can set a sampleRate between 0 and 1 in configure(), and that changing sampling or dispatching settings requires a release or an EAS Update.
Observe collects performance timing data, device model, OS version, app version, and an anonymous install-scoped ID. The page says it does not collect personally identifiable information.
The landing page says one install can start reporting real sessions in minutes after installing expo-observe. It also says five startup metrics begin reporting from real sessions, with router integration adding per-screen timings.
The pricing page shows Observe is included in all listed EAS plans, including Free, Starter, Production, and Enterprise, with included events varying by plan.

ClawTick is an AI agent automation platform for scheduling jobs from the CLI, dashboard, or REST API. Built for developers and teams using LangChain, CrewAI, webhooks, or custom workflows with monitoring, alerts, and logs.

OpenFlags is an open-source, self-hosted feature flag platform for JavaScript teams, with local evaluation, targeted rollouts, and controlled launches.

Rectify is an all-in-one SaaS operations platform with session replay, monitoring, support, code scanning, roadmaps, and changelogs for product teams.

ByteAsk is a terminal-first AI coding agent for C and C++ that edits repos and verifies changes with compilers, debuggers, sanitizers, and tests.

PromptScout tracks how ChatGPT, Gemini, Google AI Overviews, and Perplexity mention your brand or competitors, with source analysis and website audits.

Sleek Analytics is a privacy-friendly web analytics tool with real-time visitor tracking, Core Web Vitals, and revenue attribution.