
Interactive chart building
Supports seven chart types, including bar, line, area, pie, radar, radial, and composed charts, with options for colors, gradients, stacked or horizontal layouts, reference lines, labels, legends, and tooltips.

Charted Data is a blog platform for publishing interactive charts and data visualizations on your domain, with CMS, MDX publishing, and built-in SEO tools.
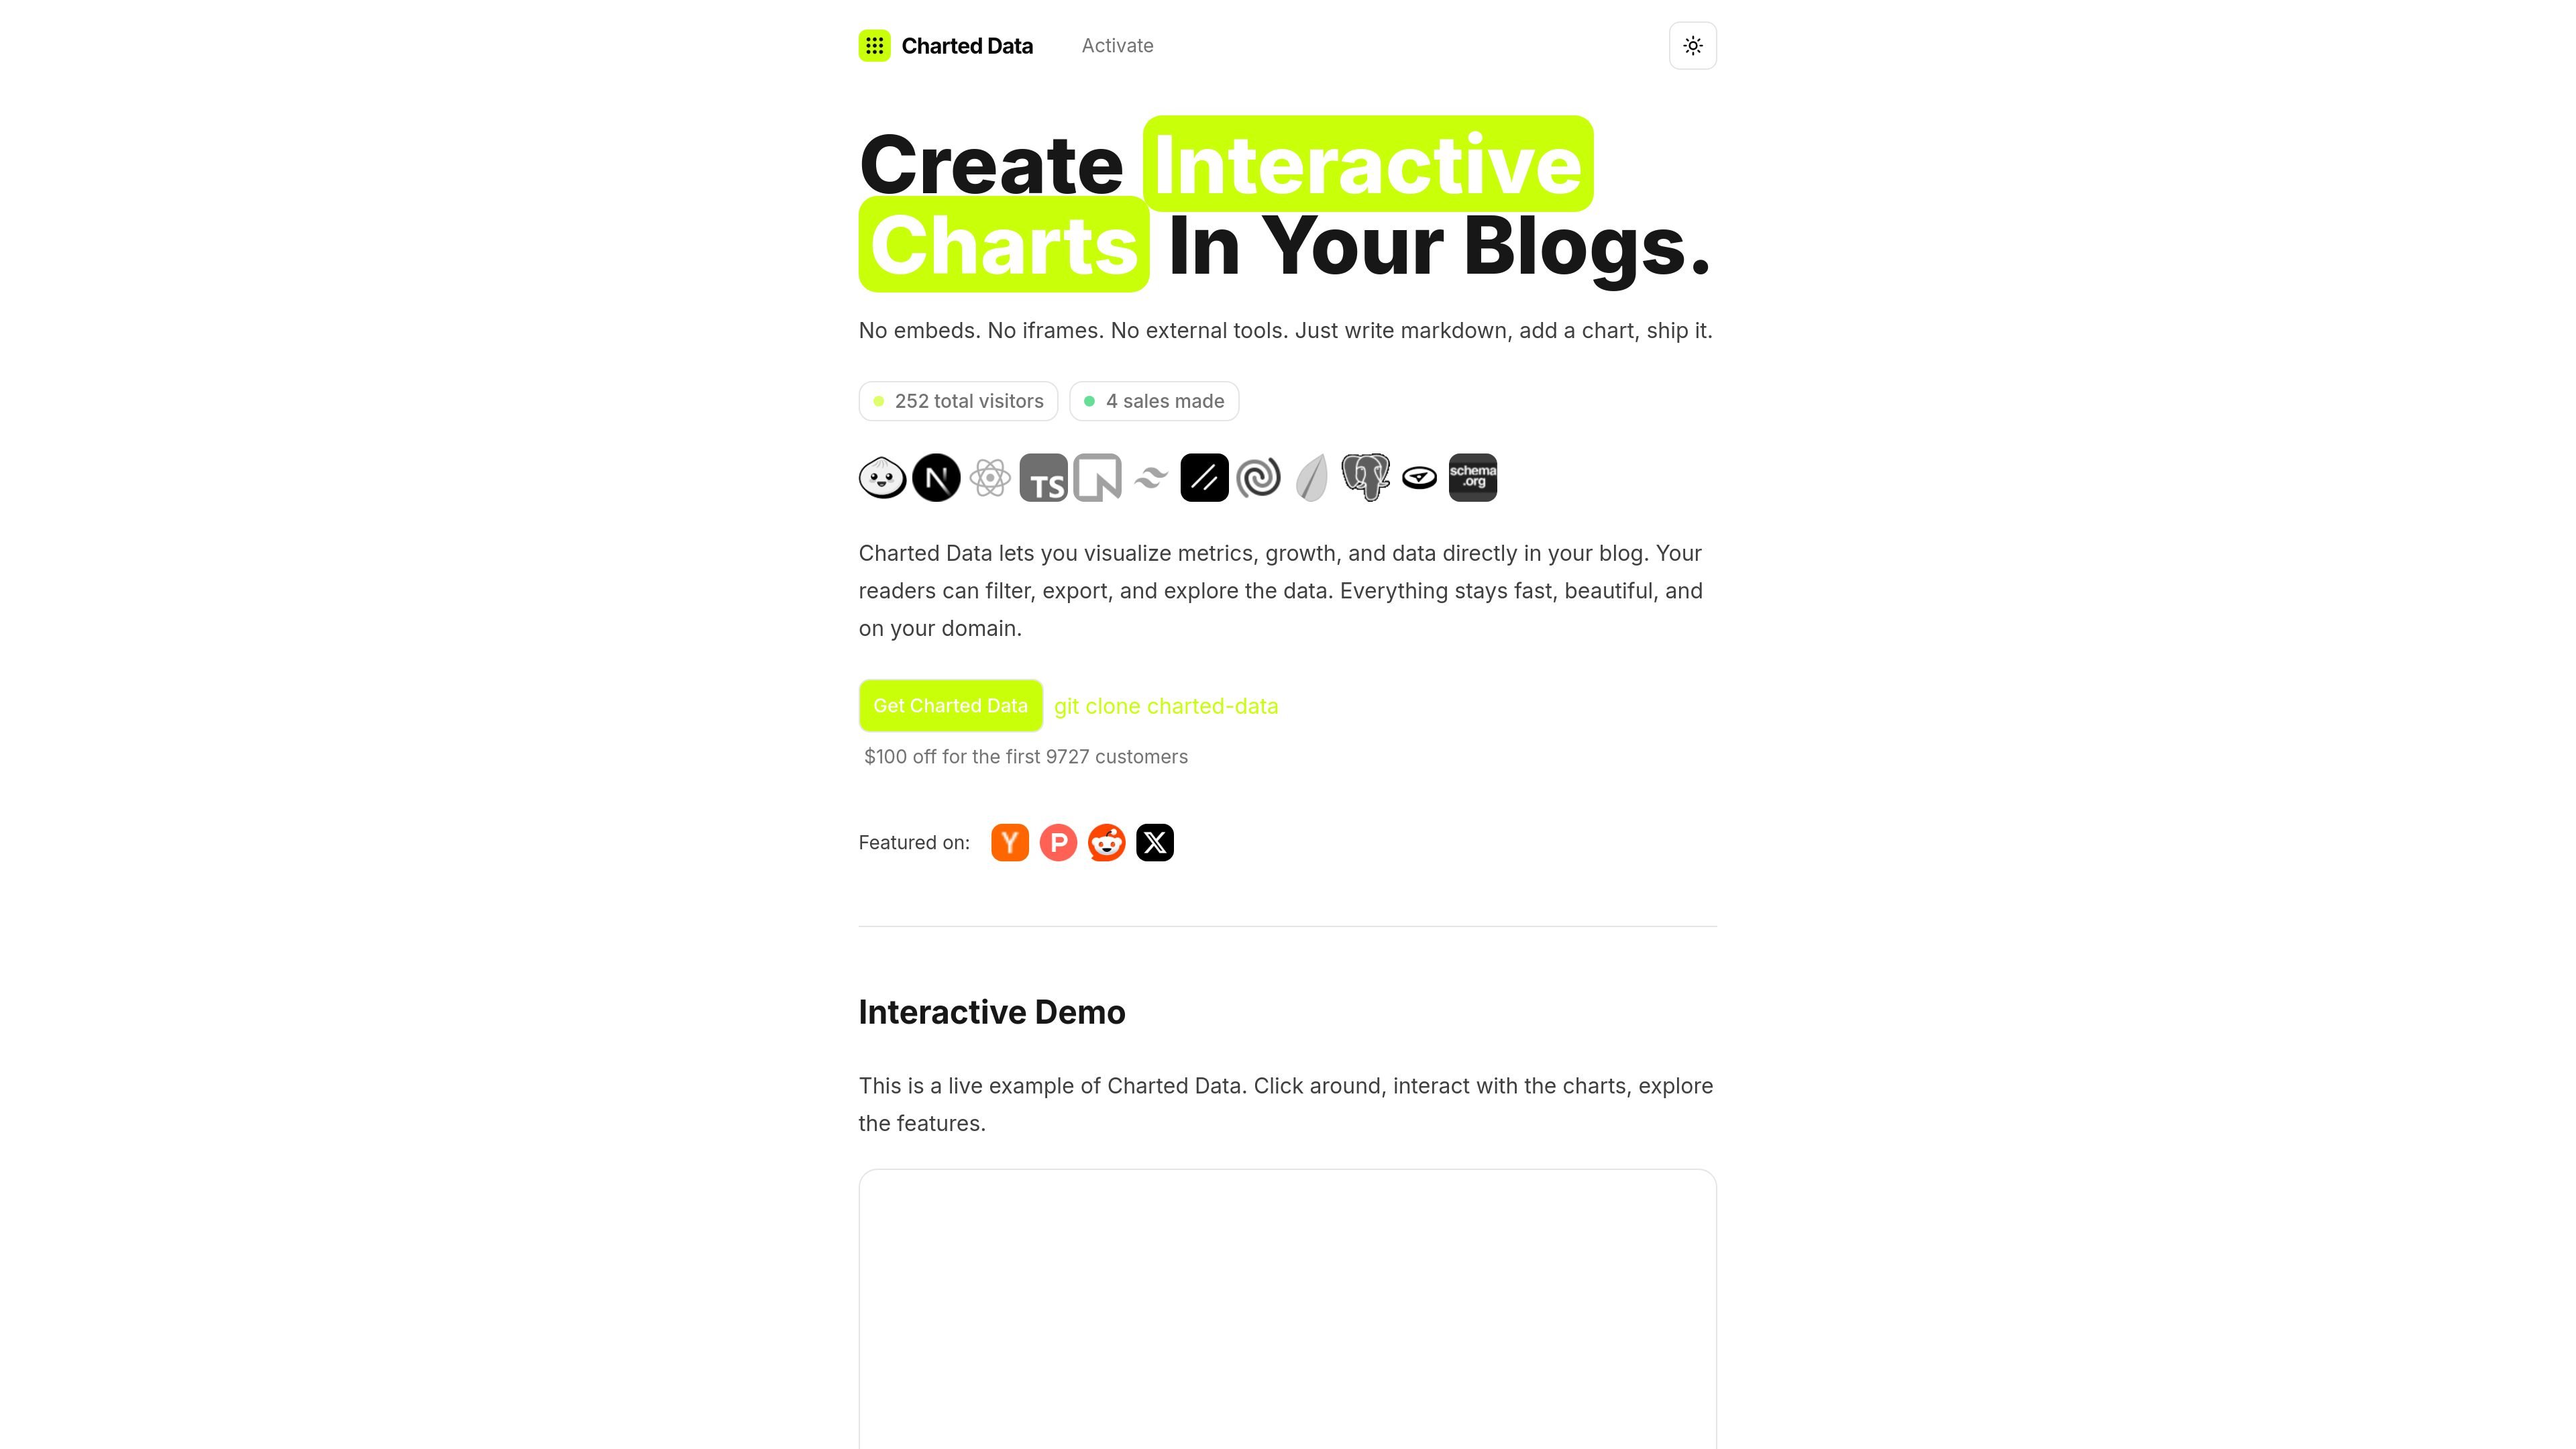
Charted Data is a blog platform for publishing posts with interactive charts and data visualizations on your own domain. It is positioned for creators who want to replace screenshots and static embeds with charts that readers can filter, inspect, and share.
The product combines a CMS, MDX-based publishing, chart creation, and built-in SEO tooling. The docs describe a quick-start flow that uses a repository clone, a central config file, and deployment on Vercel with Neon-powered authentication and PostgreSQL storage.
Supports seven chart types, including bar, line, area, pie, radar, radial, and composed charts, with options for colors, gradients, stacked or horizontal layouts, reference lines, labels, legends, and tooltips.
Readers can filter chart data in real time, inspect exact values on hover, and use charts on desktop or mobile with responsive behavior and keyboard/screen reader support.
Charts can be downloaded as PNG images or CSV files, and each chart can have its own shareable page with metadata and an embed code.
The blog layer supports MDX content with markdown plus React components, code blocks, tables, callouts, videos, links, images, accordions, tabs, and other interactive elements.
The CMS includes passwordless email login, create/edit post controls, draft and publish states, featured-post toggles, and metadata fields such as title, description, author, category, tags, and publication date.
Search, categories, tags, related posts, SEO metadata, canonical URLs, sitemaps, and RSS are built into the publishing experience.
Publish product updates, growth metrics, or customer stories in a blog post where readers can explore the underlying numbers instead of viewing a screenshot.
Share survey results, research findings, or financial analysis with charts that can be filtered and exported for later review.
Build technical articles with code blocks, tables, callouts, and embedded charts for documentation, tutorials, or long-form explanations.
Run a publication where editors need drafts, featured-post controls, metadata fields, and category/tag organization in one place.
Create a white-labeled blog for a client or rebrand the product output as your own, as described on the homepage pricing section.
Charted Data is a blog platform for publishing posts with interactive charts and data visualizations directly in the content, rather than as screenshots or external embeds.
The docs show a quick-start path built around forking the repository, editing config/site.ts, installing dependencies, and deploying on Vercel with environment variables.
Yes. The site and docs describe a built-in admin CMS with passwordless email authentication for creating, editing, drafting, and featuring posts.
The features page says charts can be exported as PNG or CSV, and it also mentions dedicated chart pages with metadata and an embed code option.
The source does not show the pricing page itself; the homepage presents one-time purchase tiers with lifetime updates, but the pricing URL currently returns a 404 page.

Blazly SEO is an AI content operating system for planning, writing, optimizing, and publishing SEO blogs from keyword research to CMS publishing.

PromptScout tracks how ChatGPT, Gemini, Google AI Overviews, and Perplexity mention your brand or competitors, with source analysis and website audits.

ClayHog is an AI search visibility platform for tracking brand presence in ChatGPT, Gemini, Perplexity, Claude, and Google AI Overviews from one dashboard.

beehiiv is a newsletter platform for creators, publishers, and brands to build, grow, and monetize email newsletters and websites in one place.

Napkin AI turns text into editable visuals for presentations, documents, and shareable content. Text-first generation, collaboration, and export to PPT, PNG, SVG, or PDF.

Scribeist is an AI writing platform for novels, blogs, essays and notes, with project-aware AI, fiction continuity tools, SEO blog tools and publishing integrations.