
Synchronized session and trace view
Captures a browser session and places network requests, backend spans, and database activity beneath it on a synchronized viewer timeline.

Syncline is an open-source, self-hostable observability tool linking browser session replays with OpenTelemetry traces and database activity on one timeline.
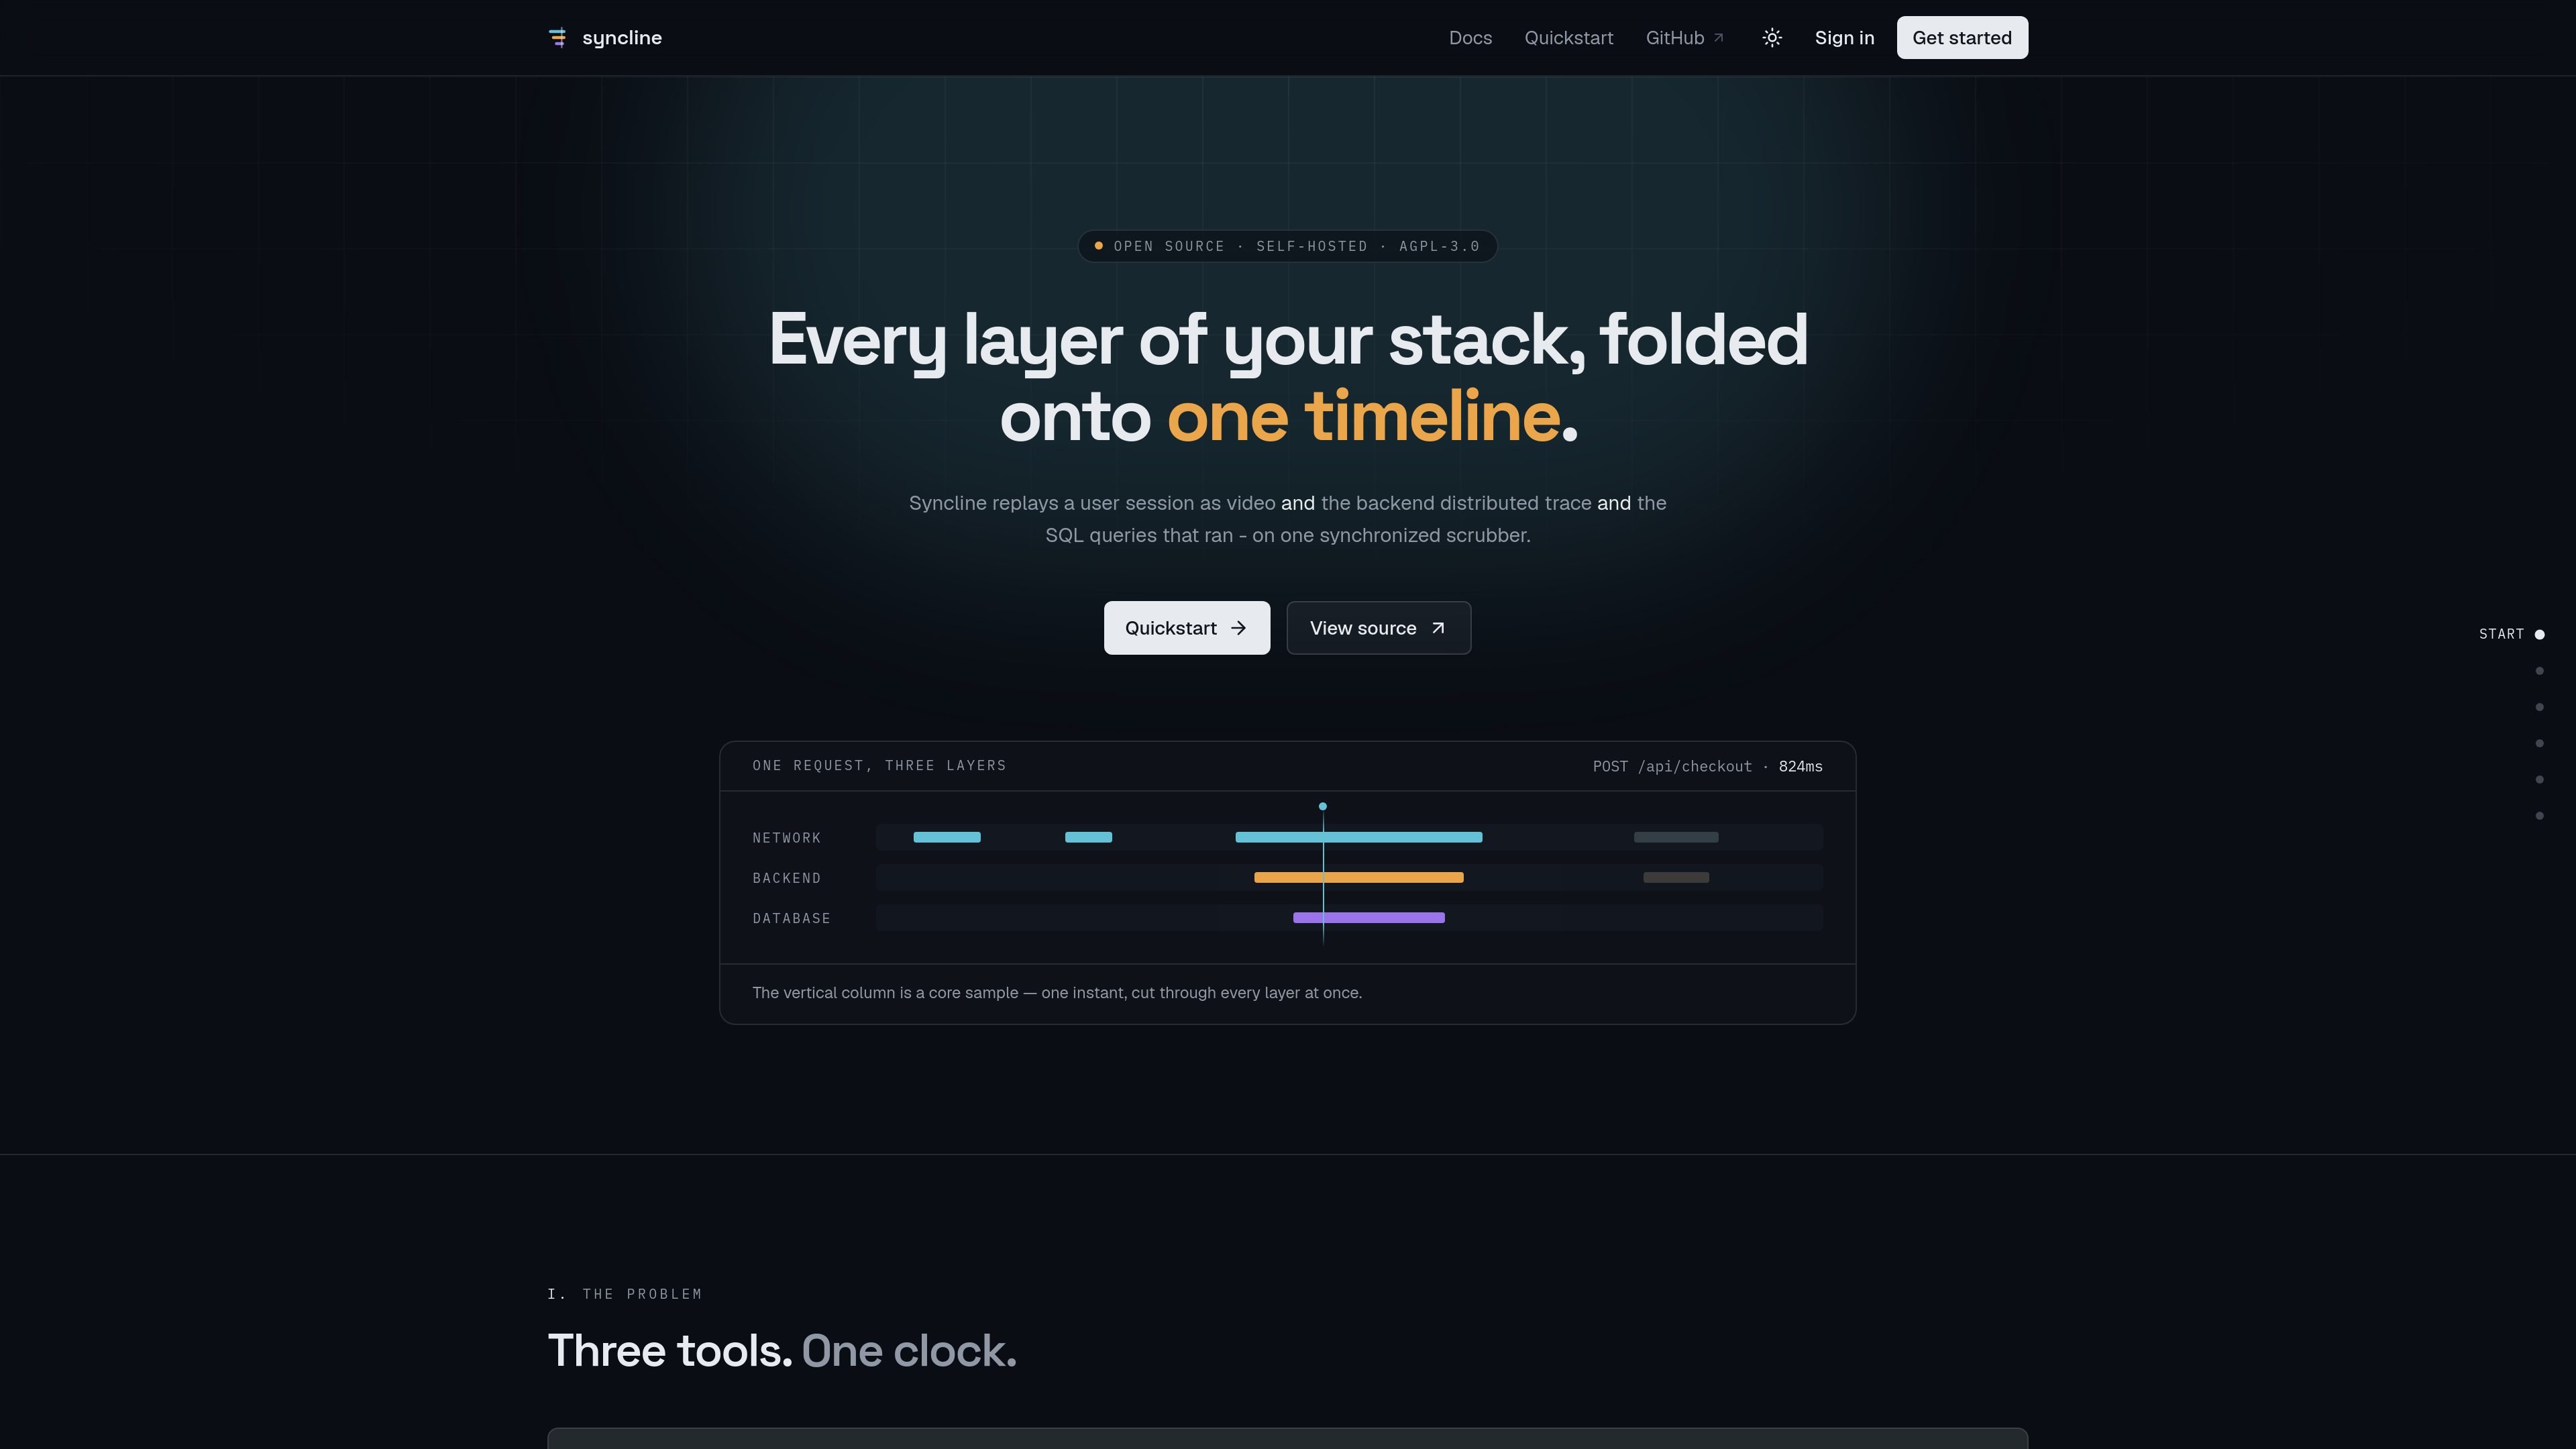
Syncline is an open-source, self-hostable observability tool that connects browser session replay with backend distributed tracing. It records a user session as a replay, links requests to W3C trace context, and displays the related network, service, and database activity on a shared timeline.
The product is designed to shorten investigations where a browser symptom must be matched to server-side work. A request can be followed from the user’s interaction through the backend span tree and into database queries, while the viewer distinguishes timing uncertainty instead of relying on a potentially misleading timestamp-only join.
Captures a browser session and places network requests, backend spans, and database activity beneath it on a synchronized viewer timeline.
The browser SDK patches fetch and XHR for configured origins, attaches W3C trace context, and writes trace identifiers into the rrweb recording.
Accepts standard OpenTelemetry data without requiring a Syncline-specific backend SDK. Existing exporters can send data directly, or a collector can fan out data alongside another tracing vendor.
Shows span attributes such as db.statement, HTTP status, service, and trace ID, and lets users click a request to focus the timeline around it.
Uses Postgres for indexing, an S3-compatible object store for recordings, and Redis with BullMQ for queued processing. The API streams payloads to storage and workers handle validation and indexing.
Provides masking and constrained capture defaults, including masked inputs, stripped query values, removed URL fragments, and no captured headers or request bodies.
Start with a user’s recorded interaction, identify the request fired at that moment, and inspect the downstream service and database spans without manually aligning separate tools.
Use the replay to understand what a user clicked, entered, or abandoned, then examine the corresponding trace to distinguish a browser, network, backend, or database cause.
Click a request in the viewer to focus the surrounding interval and inspect its full span attributes, including HTTP status, serving service, trace ID, and database statement.
Export a session recording and share it for investigation; trace identifiers embedded in the rrweb stream allow the recording to retain its trace links rather than depending on a separate correlation table.
Deploy the stack inside an organization’s infrastructure when session recordings should remain on its own Postgres, Redis, and S3-compatible storage rather than leaving the network.
Syncline combines browser session replay with backend distributed tracing and database spans. The browser SDK records the session and links requests to traces using W3C trace context, while the viewer displays the related network, backend, and database activity on one timeline.
The documented self-hosted setup uses Postgres, Redis, and MinIO in Docker, plus three Node processes for the API, worker, and web app. The quickstart requires Node 22 or newer and pnpm; the documentation describes the setup as taking about five minutes, mostly for pulling images.
No Syncline backend SDK is required. Existing services can export standard OpenTelemetry data to Syncline, with the quickstart describing the backend configuration as two environment variables and one CORS header. The browser SDK must be configured with the project’s public key, endpoint, and allowed trace origins.
Recordings use a public project key and an origin allowlist. OpenTelemetry ingestion uses the project’s secret key, which is shown once and stored as a hash. Inputs are masked by default; query values are removed from recorded URLs, fragments are dropped, and headers and request bodies are not captured.
The browser chooses sampling for recorded sessions, so a recorded request forces sampled=1. This helps ensure that the corresponding backend spans are retained when a session is available for investigation. Span placement can still show an uncertainty band when browser and server timing disagree.

ClawTick is an AI agent automation platform for scheduling jobs from the CLI, dashboard, or REST API. Built for developers and teams using LangChain, CrewAI, webhooks, or custom workflows with monitoring, alerts, and logs.

OpenFlags is an open-source, self-hosted feature flag platform for JavaScript teams, with local evaluation, targeted rollouts, and controlled launches.

EAS Observe monitors production performance in Expo and React Native apps, showing startup metrics, session timelines, release markers, and errors in the Expo dashboard.

Rectify is an all-in-one SaaS operations platform with session replay, monitoring, support, code scanning, roadmaps, and changelogs for product teams.

PromptScout tracks how ChatGPT, Gemini, Google AI Overviews, and Perplexity mention your brand or competitors, with source analysis and website audits.

Sleek Analytics is a privacy-friendly web analytics tool with real-time visitor tracking, Core Web Vitals, and revenue attribution.