CSV-to-chart workflow
Upload a CSV file and turn it into charts without writing code. The product is positioned as a fast path from tabular data to visual output.
Plotiq is a browser-based CSV chart generator that turns tabular data into charts fast, with no-code CSV upload, column selection, chart choice, and download or sharing.
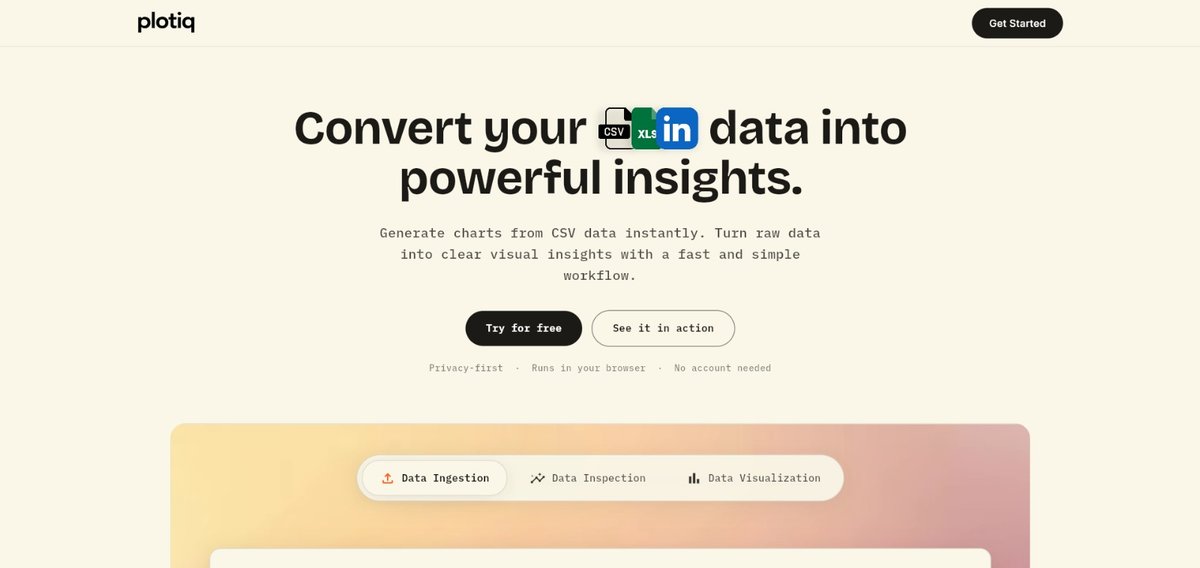
Plotiq is a browser-based CSV chart generator that turns uploaded data files into charts in a few steps. The homepage presents it as a no-code tool for creating bar charts, line graphs, scatter plots, and pie charts from CSV data.
The workflow is simple: upload a CSV file, select the X and Y columns, choose a chart type, and then download or share the result. The site positions Plotiq for students, researchers, professors, engineers, and other people who need to visualize data quickly without installing software or creating an account.
Upload a CSV file and turn it into charts without writing code. The product is positioned as a fast path from tabular data to visual output.
Choose from bar charts, line graphs, scatter plots, and pie charts based on the source data and the story you want to tell.
Select the X and Y columns before generating the visualization, which makes the workflow explicit and keeps the chart tied to the right fields.
Download or share the finished chart after generating it, which supports both private review and external presentation.
Run the tool in the browser with no sign-up required, reducing setup friction for one-off analysis or quick visualization tasks.
Convert a spreadsheet export or cleaned dataset into a quick visual without setting up analytics software or a notebook environment.
Create charts for coursework, lab reports, theses, or research papers when you need a simple way to visualize data from a CSV file.
Explore a dataset by choosing X and Y columns, then compare trends or relationships using scatter, line, or bar charts.
Generate a shareable chart for a presentation or review and use the download or share step called out in the workflow.
Use the browser-based flow when you need a chart quickly on a machine where you do not want to install additional software.
Yes. The site says you can upload a CSV file and then select the X and Y columns, choose a chart type, and download or share the result.
The homepage describes Plotiq as free and browser-based with no sign-up needed.
The homepage says Plotiq can generate bar charts, line graphs, scatter plots, and pie charts from CSV files.
The site says it is used by students, researchers, professors, engineers, data analysts, and other people working with data.
The source text does not list advanced integrations or file types beyond CSV, so the published workflow should be treated as CSV upload, chart selection, and export/share.
ClawTick is an AI agent automation platform for scheduling jobs from the CLI, dashboard, or REST API. Built for developers and teams using LangChain, CrewAI, webhooks, or custom workflows with monitoring, alerts, and logs.
Falconer is an AI-powered company brain that keeps internal docs accurate, searchable, and up to date by syncing with GitHub, Slack, and Linear.
OpenFlags is an open-source, self-hosted feature flag platform for JavaScript teams, with local evaluation, targeted rollouts, and controlled launches.
Speculos deploys Claude Code apps to shareable URLs, with private, org-wide or public visibility and team controls for domains, data and cloud deployments.
Skills Janitor is a GitHub-hosted set of slash commands for auditing, tracking, and cleaning up Claude Code and OpenAI Codex skills.
MakerLoft is a chat-first AI app builder for non-developers to create static sites or full-stack apps from a GitHub repository.