Centralized data connections
Connect business systems such as Stripe, PostHog, Google Analytics, Calendly, custom webhooks, and MCP servers, then bring the resulting metrics into one dashboard.
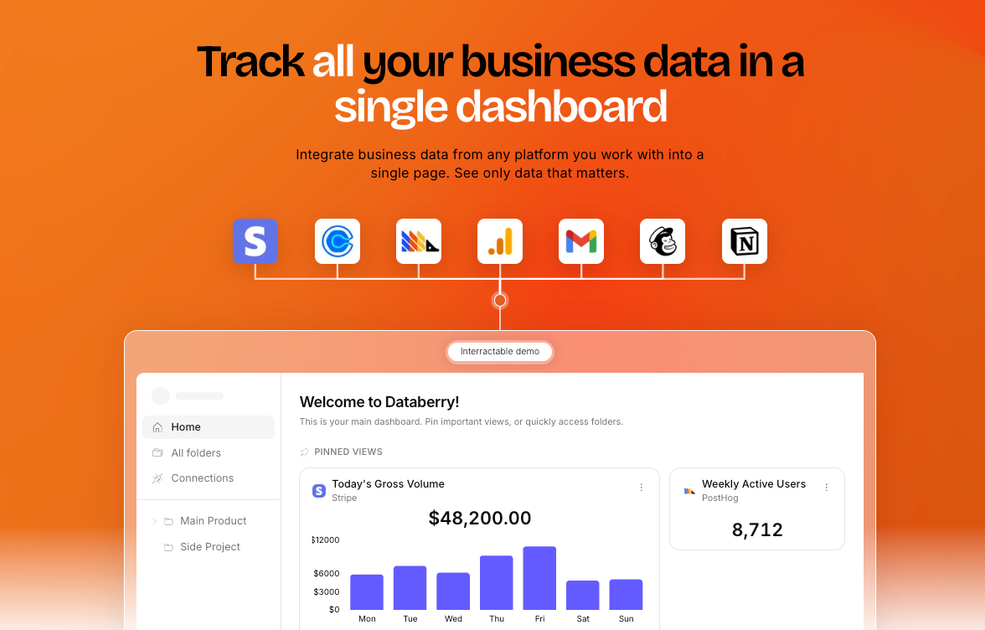
Databerry is a business dashboard for solo founders, indie hackers, and small teams. It combines data from tools like Stripe, PostHog, Google Analytics, and Calendly so key metrics can be reviewed in one place.
Databerry is a business dashboard for solo founders, indie hackers, and small teams. It is designed to pull data from the tools a business already uses and show the metrics side by side in one place.
The home page positions the product around founders who use too many tools and want a single dashboard for revenue, traffic, signups, calls, errors, and other operational data. The interface examples show dashboards built from sources such as Stripe, PostHog, Google Analytics, Calendly, Sentry, and GitHub, plus support for custom webhooks and MCP servers.
Connect business systems such as Stripe, PostHog, Google Analytics, Calendly, custom webhooks, and MCP servers, then bring the resulting metrics into one dashboard.
Track finance data in real time with revenue charts, new customer counts, MRR, balance, and gross volume pulled from Stripe.
Monitor product health from a single screen by surfacing uptime, error rates, and issues across services, with references to Sentry and GitHub in the product copy.
Review funnels, event counts, traffic sources, and customer activity side by side so marketing and product metrics stay in the same view.
Jump to a previous day and see saved daily snapshots for each view, including historical revenue, signups, and events.
Move between views such as pinned dashboards and agent mode, which are shown in the product interface examples on the home page.
Bring revenue, traffic, signups, and customer activity into one place so you can review business performance without switching between analytics tools.
Track Stripe revenue, new customer counts, MRR, and gross volume in a live financial view that updates automatically.
Watch uptime, errors, and service status across products or internal systems to catch problems before users do.
Review funnel stages, event counts, and traffic sources to understand where users drop off and which channels are contributing visits.
Open a previous day’s snapshot to compare current performance with an earlier period and spot changes in trend over time.
Databerry is a business dashboard for solo founders, indie hackers, and small teams. It brings together data from tools such as Stripe, PostHog, Google Analytics, Calendly, custom webhooks, and MCP servers so users can view key metrics in one place.
The source shows account creation and login flows, including Google sign-up and password reset. It does not provide a detailed setup guide, so the exact onboarding steps are not described publicly.
The product is presented as a dashboard for founders and small teams rather than a team collaboration suite. The public pages do not describe roles, permissions, or multi-seat administration.
The site shows connections for data sources such as Stripe, PostHog, Google Analytics, Calendly, custom webhooks, and MCP servers. It also references monitoring Sentry and GitHub in the feature sections, but the public pages do not provide a complete integration catalog.
The pricing page is login-gated in the collected material. It confirms there is an account sign-in flow, but it does not expose public pricing tiers or plan limits in the available source text.
PromptScout tracks how ChatGPT, Gemini, Google AI Overviews, and Perplexity mention your brand or competitors, then pairs those results with source analysis and website audits. It helps teams decide what to fix in content, positioning, or site readiness next.
SaveMRR is a Stripe retention tool for SaaS teams that scans billing data for churn and MRR leaks, then automates recovery through dunning, cancel-save offers, win-back emails, and onboarding nudges. It is built for founders and bootstrapped teams using Stripe.
Hype is a web tool for finding trending YouTube topics by category, time range, and scoring mode. Spot emerging ideas and review source videos.
Sleek Analytics is a privacy-friendly web analytics tool with real-time visitor tracking, Core Web Vitals, and revenue attribution. It helps site owners understand traffic and conversions without cookie banners or a heavy setup.
Struere is an AI-native platform for turning spreadsheet data into structured operational software with dashboards, alerts, and automations. It is aimed at teams that want to replace manual spreadsheet workflows without building custom tools from scratch.
ClayHog is an AI search visibility platform for tracking brand presence in ChatGPT, Gemini, Perplexity, Claude, and Google AI Overviews from one dashboard.