ExcelFormuLab
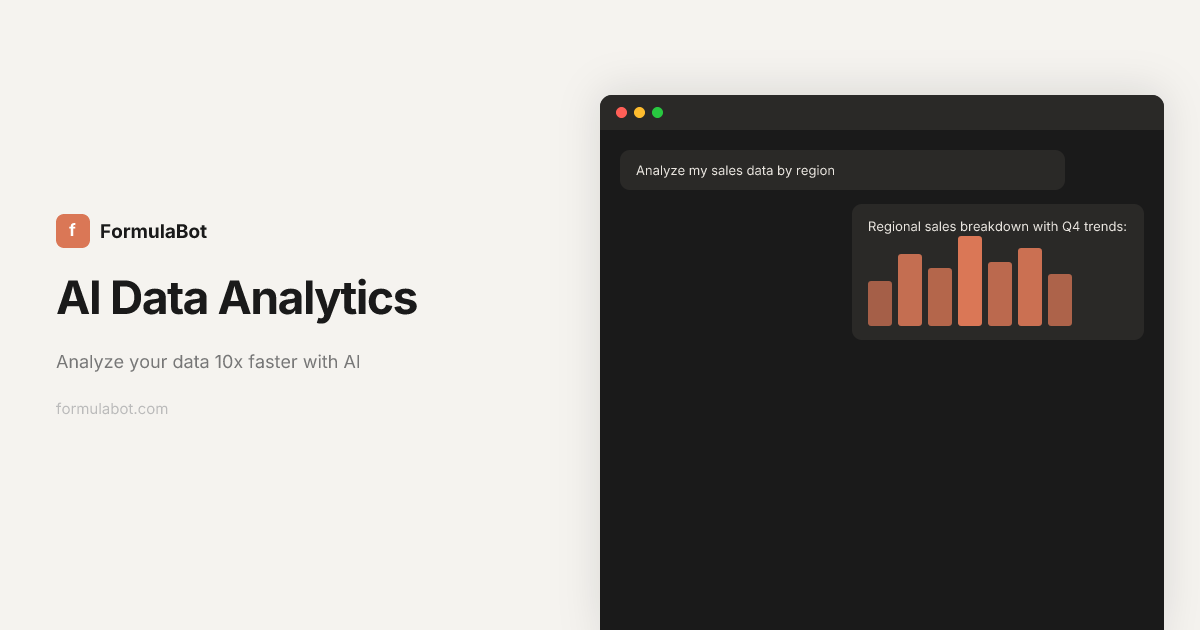
ExcelFormuLab is an AI data analyst for spreadsheets that turns your questions into answers, charts, and exports—upload or connect data.
What is ExcelFormuLab?
ExcelFormuLab is an AI assistant for working with data in spreadsheets and related formats. It lets you upload or connect data, ask questions in plain language, and receive outputs such as charts, tables, and reports.
Its core purpose is to speed up common data workflows—analysis, visualization, text analysis, and preparing data for further work—while also showing the generated code so you can verify and export results.
Key Features
- Ask questions in plain language (including other languages): Turn questions into answers plus structured outputs like charts and tables.
- Data visualization from your dataset: Generate charts and graphs from uploaded data to display analysis results clearly.
- Data preparation and transformation: Clean, reshape, merge, and organize data (e.g., filtering rows, reformatting columns) to make datasets analysis-ready.
- Text analysis tools: Perform sentiment detection, keyword extraction, and translation on text inputs such as customer reviews.
- Code transparency for every request: View the exact generated code (shown in examples for Python/Pandas, SQL, and chart creation) to verify steps and reuse logic.
- Export spreadsheets and formatted reports: Produce downloadable outputs such as Excel files and generate formatted reports based on your analysis.
- Scheduled reporting: Define recurring analysis steps and run them on a schedule (daily, weekly, or monthly) when new data is available.
- Embeddable analytics (iframe): Add an AI-powered analytics chat to a website using an iframe snippet.
- Data security and isolation controls: Data is stored and executed in a dedicated, isolated sandbox per chat; row-level security is available for database connections; and the product states it does not use your data to train AI models.
How to Use ExcelFormuLab
- Start a session and add your data: Upload a file or connect data sources so the assistant can work from your dataset.
- Ask questions: Write your request in plain English (or another language) and specify what you want to know or create (e.g., a chart or a table).
- Review outputs: Use the generated answers, charts, and transformed data to confirm they match your intent.
- Check the generated code (if needed): Open the code transparency view to see the underlying Python/SQL/chart logic used for your request.
- Export or automate: Export results to Excel/reports, or set up a scheduled playbook to rerun the workflow on a recurring cadence.
Use Cases
- Sales performance summaries: Upload sales data and ask how daily or weekly sales performed, then use the returned tables/charts to summarize trends.
- Profit analysis by time period: Request aggregations like total profit by month, then use the visualization and table output to interpret changes across months.
- Cleaning and reshaping messy datasets: Provide datasets with inconsistent columns or formats and ask the assistant to reshape, merge, or reformat the data into an analysis-ready structure.
- Customer review sentiment: Paste or upload review text and ask for sentiment detection; use the analysis results to categorize reviews into positive/neutral/negative.
- Recurring reporting: Define a repeated analysis step (e.g., a sales report) and schedule it to run daily, weekly, or monthly as fresh data becomes available.
FAQ
-
Can I export results to Excel? Yes. The site describes exporting outputs to Excel and generating formatted spreadsheets/reports.
-
Does the product show how it generated an answer? Yes. It provides “code transparency,” showing the code generated for each request (examples include Python, SQL, and chart code).
-
What kinds of inputs can I analyze? The page mentions uploading/connecting data sources and also includes text analysis for sentiment detection, keyword extraction, and translation.
-
How does scheduling work? You can define recurring analysis steps once, then run them on a schedule (daily, weekly, or monthly) with fresh data.
-
How is my data protected? The page states that data is stored and executed in an isolated sandbox environment per chat, that row-level security can be applied for database connections, that data is encrypted in transit and at rest, and that it does not use your data to train AI models.
Alternatives
- AI spreadsheet assistants: Tools that focus on natural-language analysis inside spreadsheets can provide quick answers and charts, but may offer less code transparency and automation depth.
- Business intelligence (BI) platforms: BI tools support dashboards and scheduled reporting, typically with a stronger emphasis on visualization and governance rather than conversational analysis.
- Notebook-based data analysis (e.g., Python/SQL workflows): Writing your own Python/SQL offers maximum control and reproducibility, but requires more manual setup for data prep, chart generation, and recurring reports.
- ETL/data preparation tools: Dedicated data transformation tools excel at cleaning and shaping data pipelines; they may not provide conversational charting and text analysis in the same workflow.
Alternatives
Bricks
Bricks is the easiest way to turn your CSV & Excel files into beautiful, editable dashboards - no setup required.
SaveMRR
SaveMRR scans Stripe billing data to find SaaS MRR leaks and help recover failed payments, save cancellations, and win back churn—60-sec Free Revenue Scan.
Sleek Analytics
Lightweight, privacy-friendly analytics with real-time visitor tracking—see where visitors come from, what they view, and how long they stay.
Struere
Struere is an AI-native operational system that replaces spreadsheet workflows with structured software—dashboards, alerts, and automations.
ClayHog
ClayHog tracks AI Search Visibility & GEO—see what ChatGPT, Gemini, Perplexity, Claude, and Google AI Overviews say about your brand, incl. citations and sentiment.
beehiiv
beehiiv is an all-in-one newsletter and website platform with publishing, growth, analytics, and monetization tools for creators and brands.